Our weekly Hi-Tech Chart 1st July 2026
Gold
Each Monday we upload a new sample of a Hi-Tech Chart. Scroll down to see this week's chart and to see a library of previous releases. DOWNLOAD the full weekly bulletin covering December to current, or email us to receive this week's market daily bulletin for the next 30 days FREE
markethotspots@gmx.com
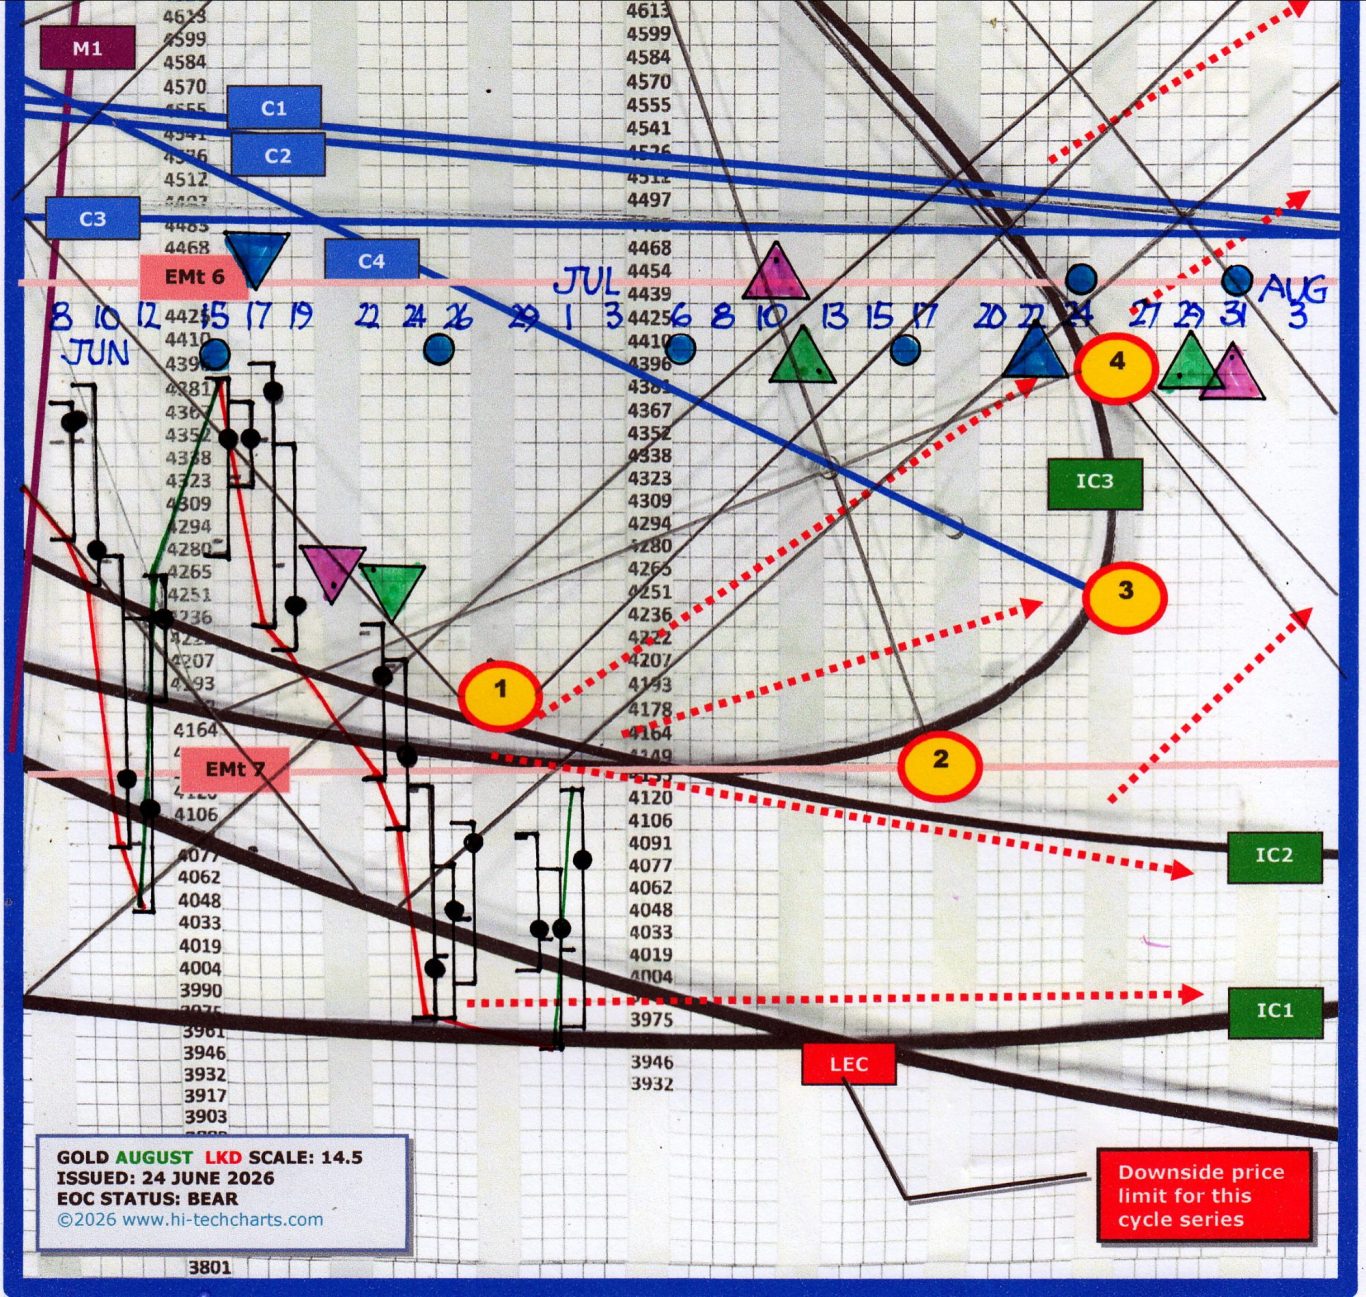
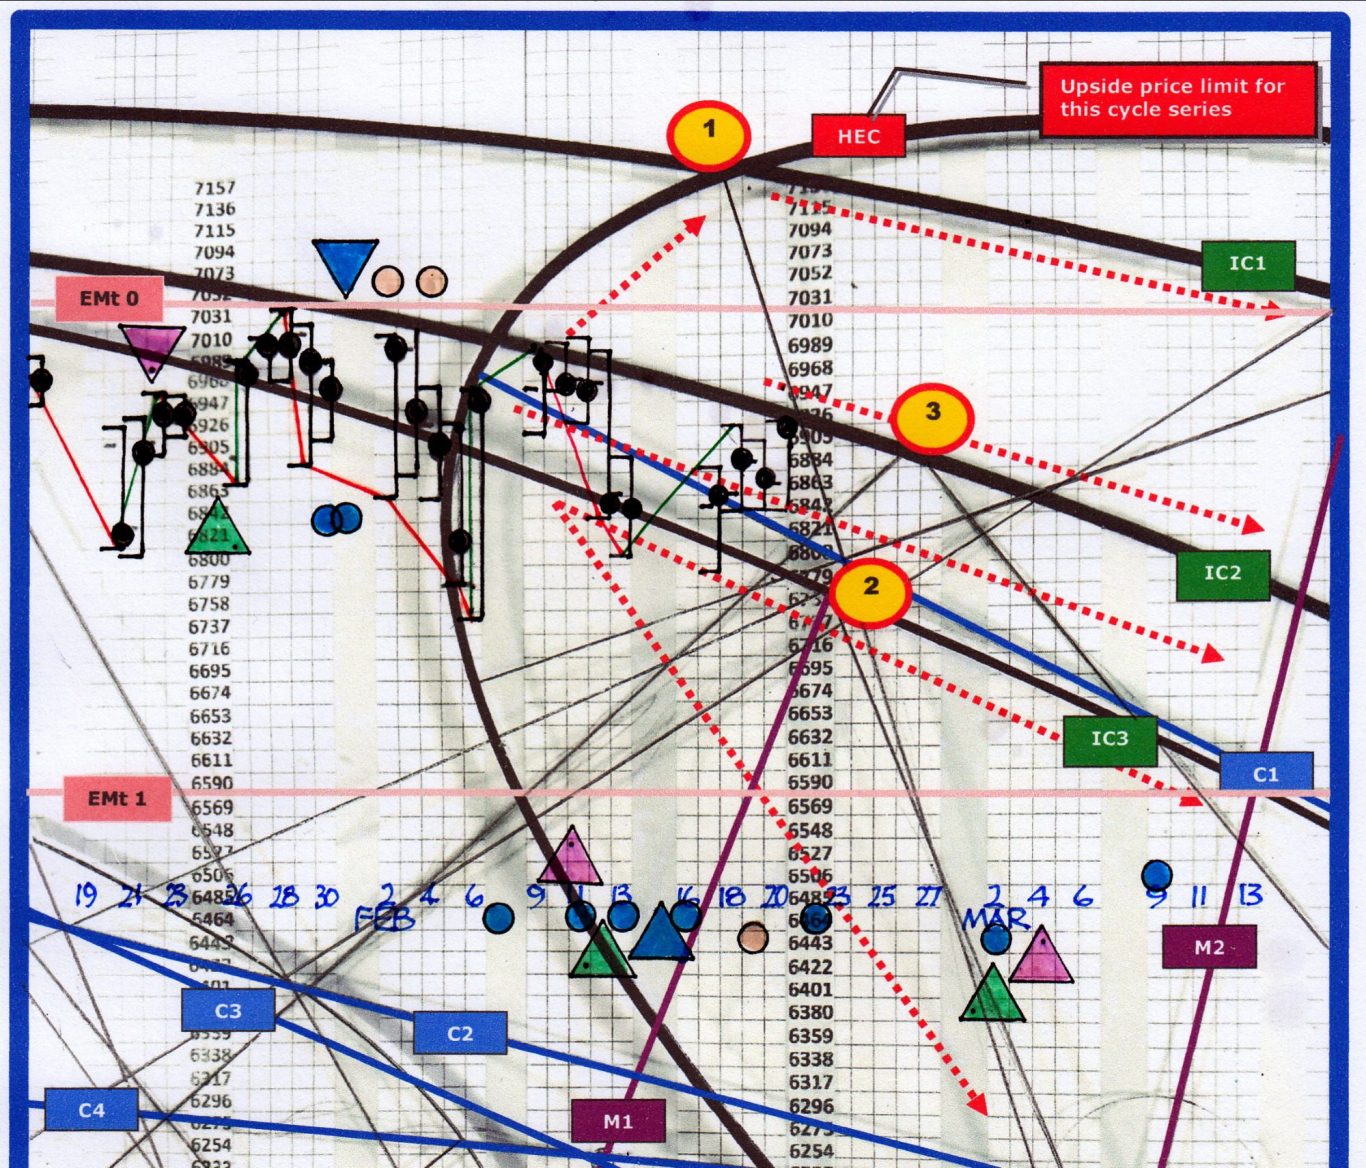
Although we assess Gold to be in a bear market, there is the potential for the bear market bottom to be forming at the present time. Price action is stabilised at LEC – the extreme low support in the current cycle series –
………….. and once price breaks up through IC2, Gold will be out of the channel trapping it. If that IC2 break occurs in the next 7-10 days, expect price action in the ending IC3 cycle, with target 4 on the upper limit. From August, Gold will climb well above the blue C lines.
Our weekly Hi-Tech Chart 4th May 2026
Wheat
Each Monday we upload a new sample of a Hi-Tech Chart. Scroll down to see this week's chart and to see a library of previous releases. DOWNLOAD the full weekly bulletin covering December to current, or email us to receive this week's market daily bulletin for the next 30 days FREE
markethotspots@gmx.com
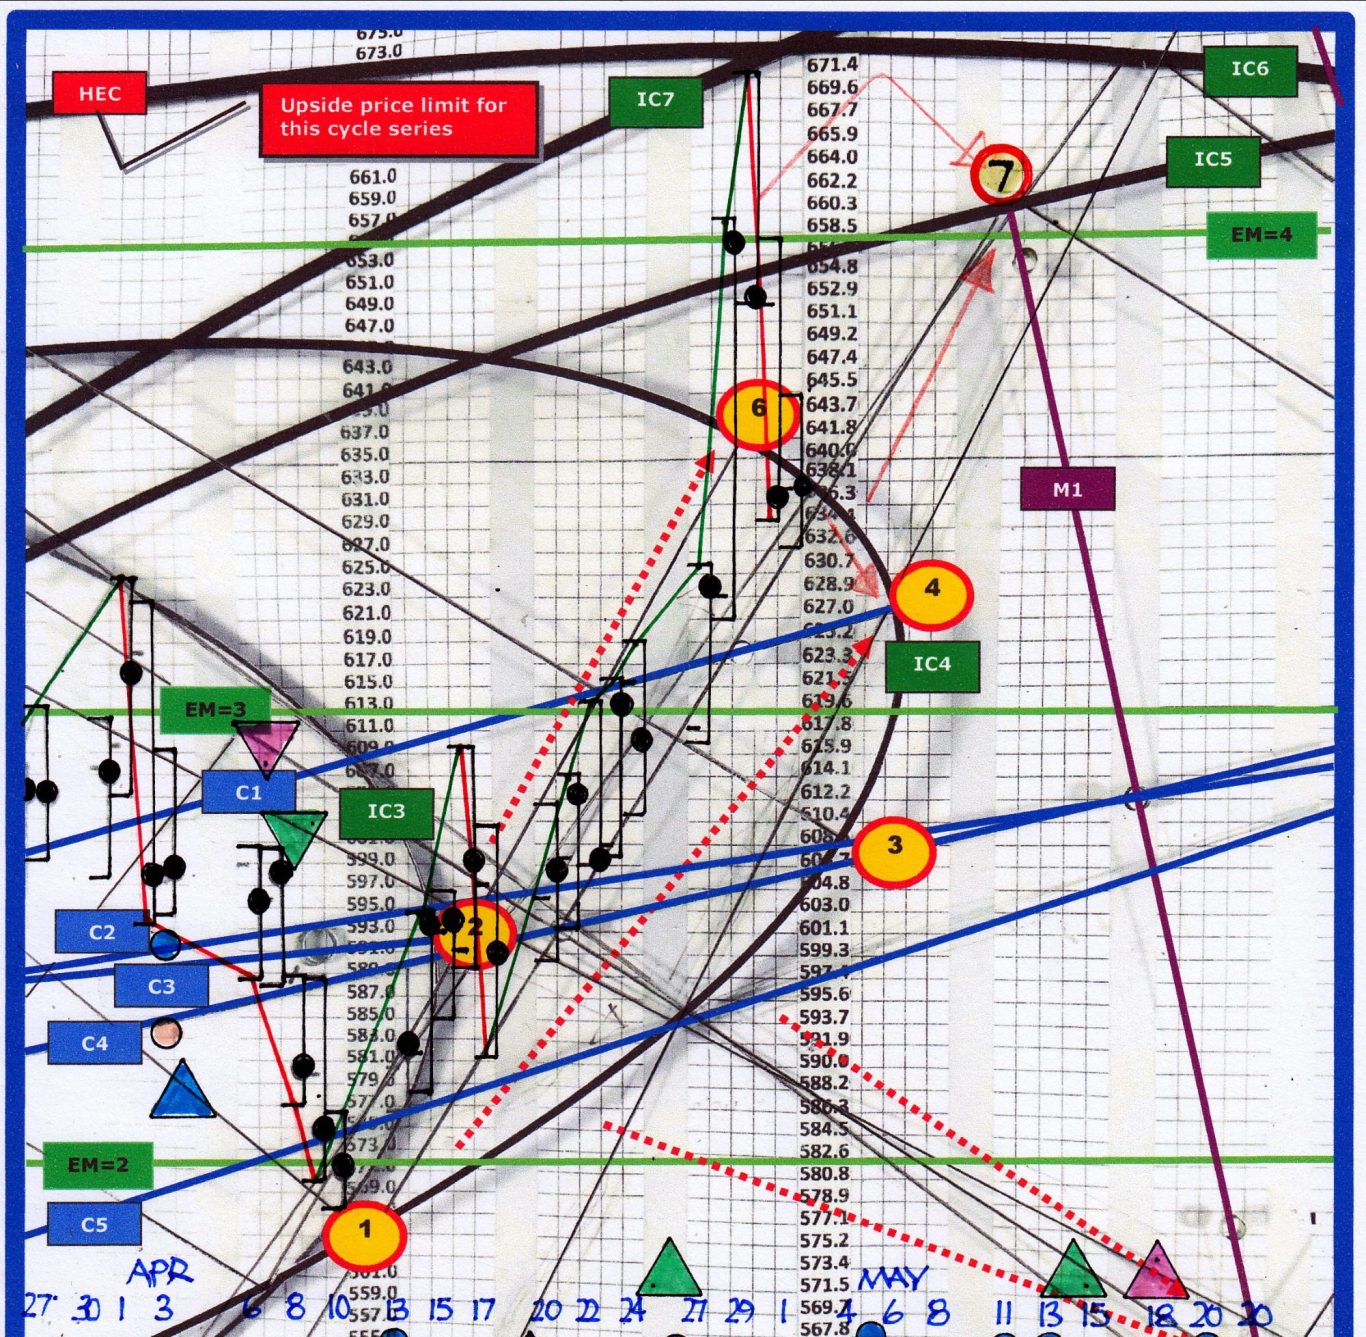
There was a buy signal at target 1 on the 10th April at 580.00–582.00. While closes remained above IC4 there was no signal to exit the long trade until price entered the zone just below HEC, it being the upper price limit for Wheat..……………
………….. A reversal from long to short was indicated around 669.00 on the 29th April. Shorts should be covered if wheat trades in the end of the IC4 cycle, or between 610.00 and 627.00.
Our weekly Hi-Tech Chart 2nd March 2026
Nasdaq 100
Each Monday we upload a new sample of a Hi-Tech Chart. Scroll down to see this week's chart and to see a library of previous releases. DOWNLOAD the full weekly bulletin covering December to current, or email us to receive this week's market daily bulletin for the next 30 days FREE
markethotspots@gmx.com
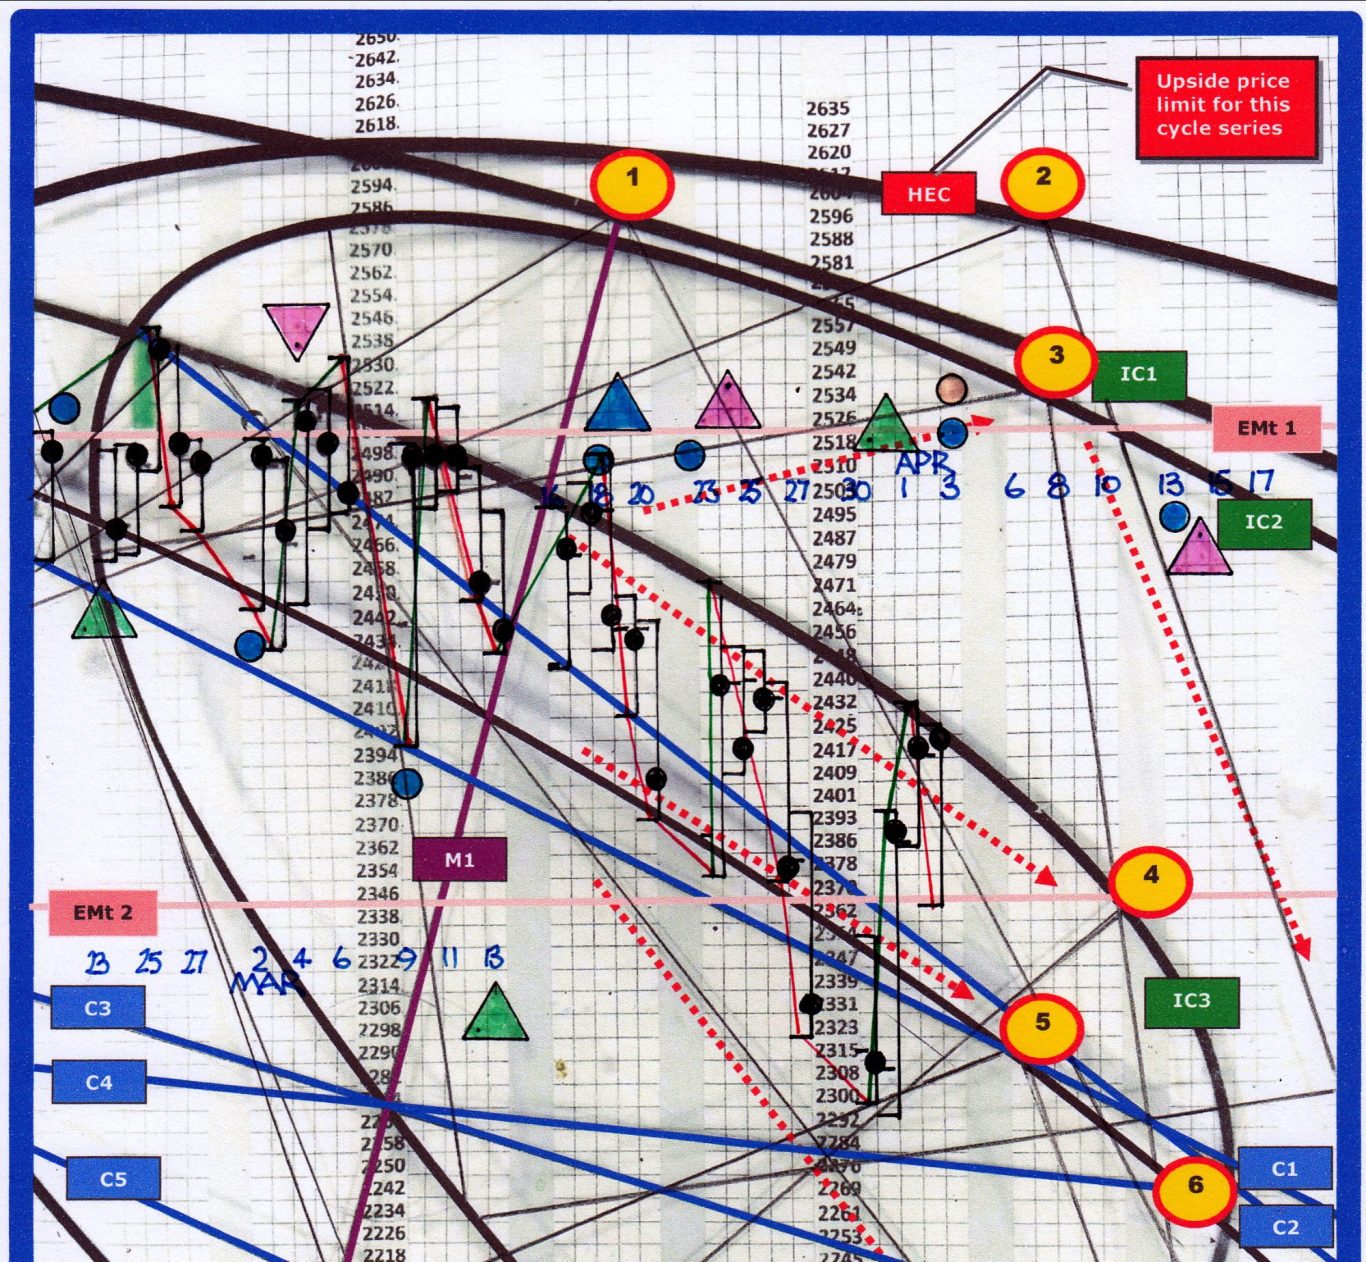
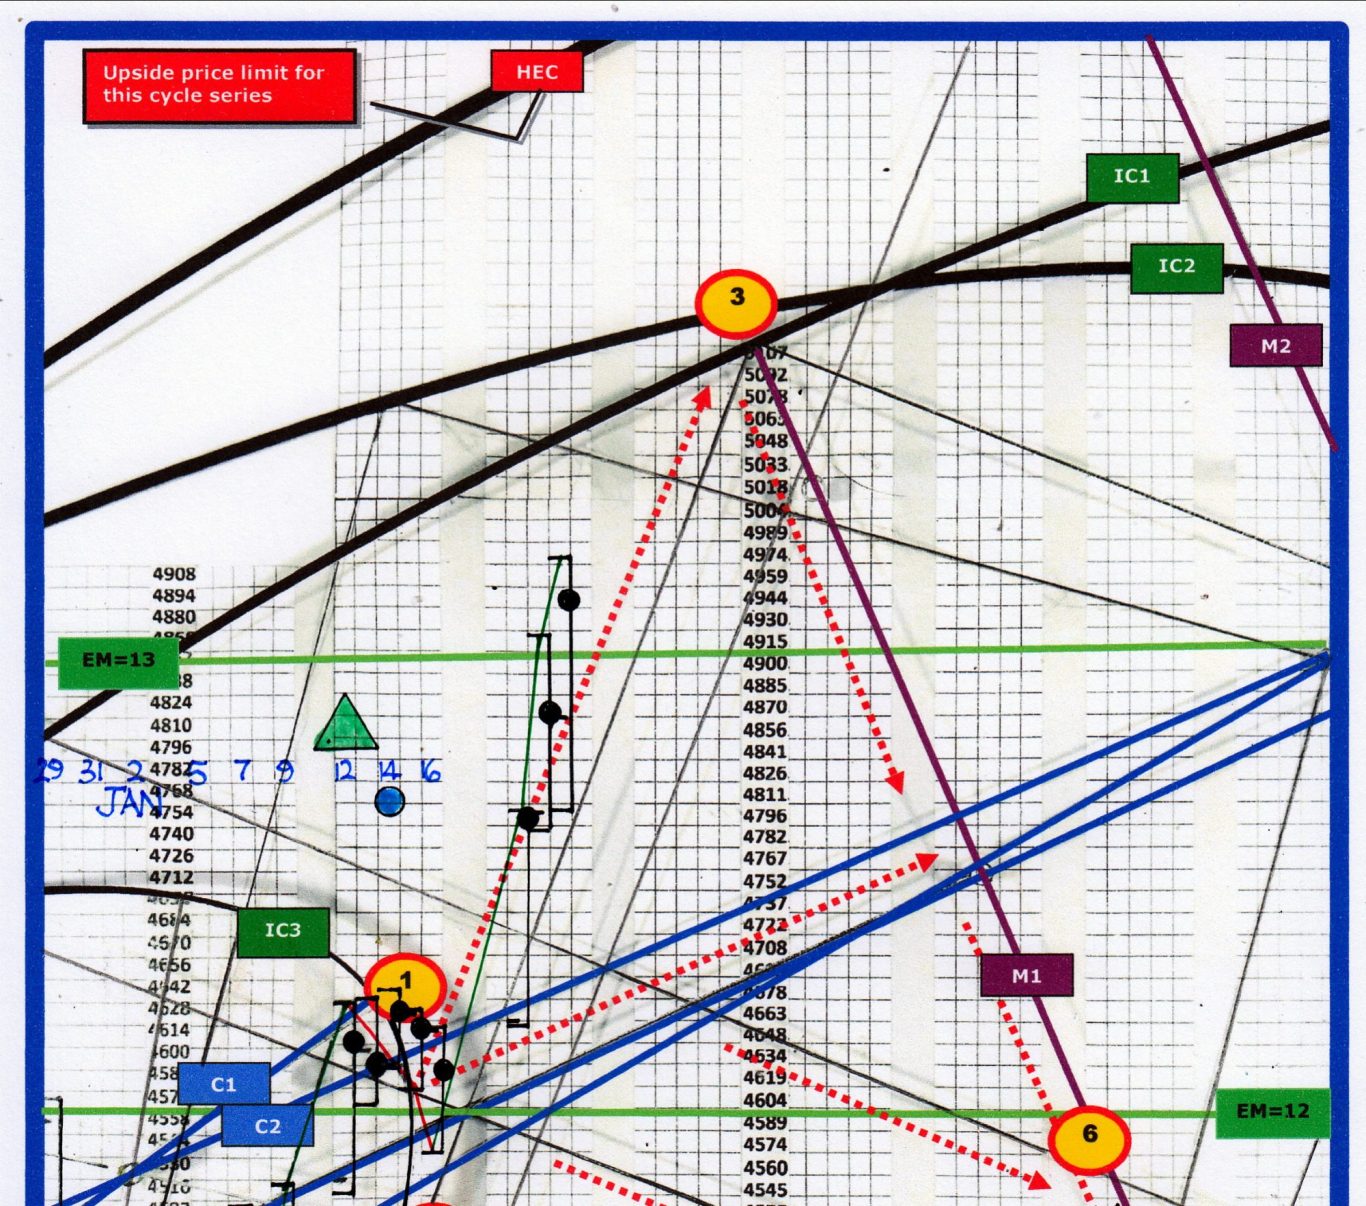
This Nasdaq analysis was first released on 13th March ’26 (bottom chart) and in that forecast we predicted Nasdaq would fall in the IC3/IC4 channel as indicated by the red directional arrows. Only two closes traded outside this channel and that while price action remained in this channel,.……………
………….. Nasdaq would end the fall at target 6 around the 13th April. IC3 acts as a powerful resistance line and if price action crosses above it, there will be a rally up to IC2 – a major bear market top.
Our weekly Hi-Tech Chart 23rd February '26
SP500
Each Monday we upload a new sample of a Hi-Tech Chart. Scroll down to see this week's chart and to see a library of previous releases.
DOWNLOAD the full weekly bulletin covering December to current, or email us to receive this week's market daily bulletin for the next 30 days FREE
markethotspots@gmx.com
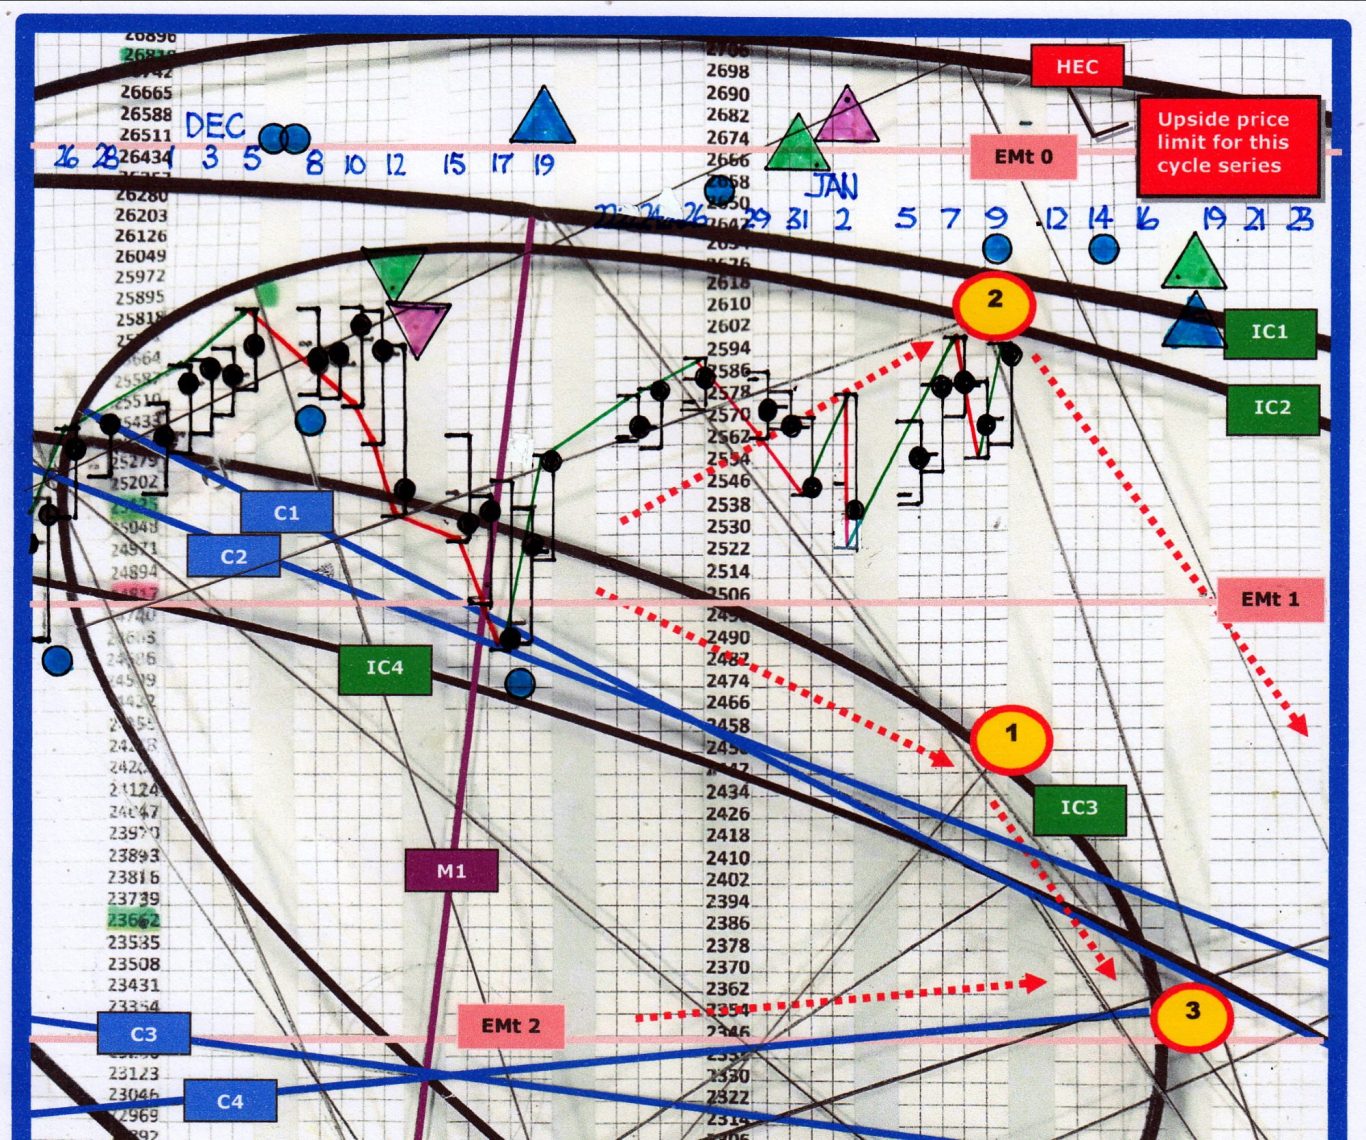
SP500 has been trapped in the narrow channel between IC2 & IC3 with only 1 close outside (5th Feb). It is possible price action will enter the IC1/IC2 channel to make a final top. .……………
………….. On the other hand, IC3 is the key support and once closes break below, it is highly likely price will fall to the lower C lines (around 6250) and not trade above IC3.
Our weekly Hi-Tech Chart 22nd January '26
GOLD
Each Monday we upload a new sample of a Hi-Tech Chart. Scroll down to see this week's chart and to see a library of previous releases.
DOWNLOAD the full weekly bulletin covering December to current, or email us to receive this week's market daily bulletin for the next 30 days FREE
markethotspots@gmx.com
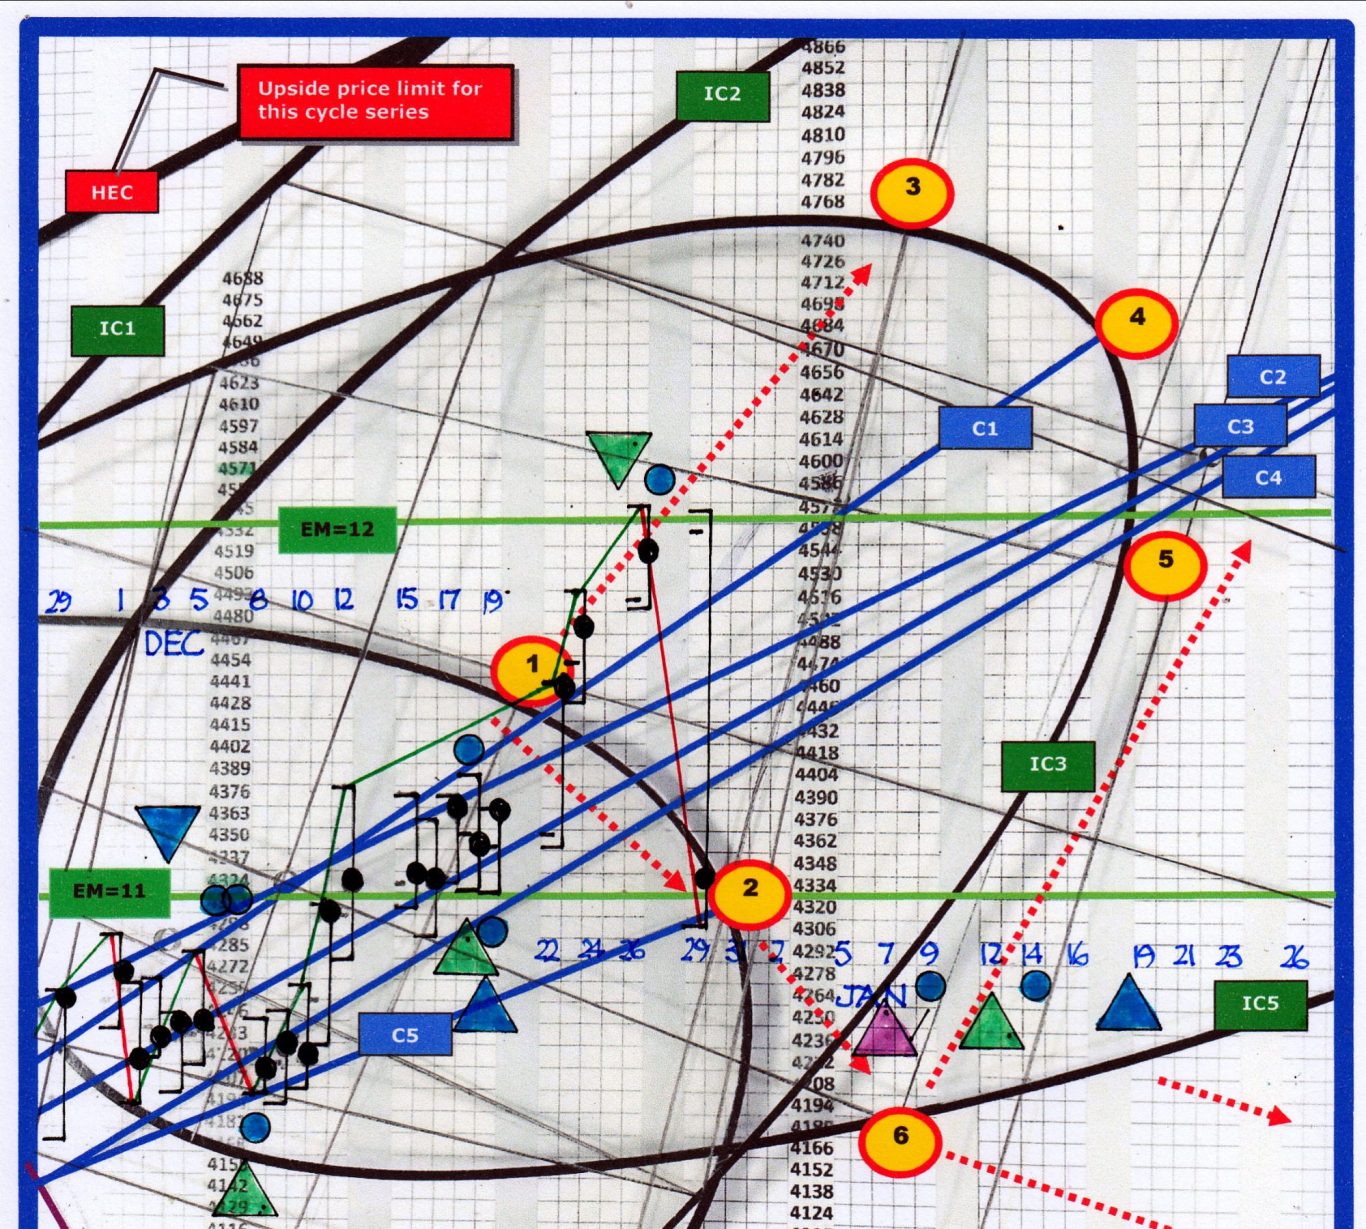
As forecast in this analysis release of 13 January, Gold has rallied from the blue C lines and that rally would likely be heading to target 3 – and so it is. There is strong resistance at that level (around 5100) and it is likely to halt further rises as long as closes remain below IC2.……………
………….. M1 is a powerful down-force line and has the potential to force a sharp fall back to the C lines, but once closes break to the right of M1, Gold is free move higher – back to IC2, or higher if closes are above IC2.
Our weekly Hi-Tech Chart 12th January '26
NASDAQ
Each Monday we upload a new sample of a Hi-Tech Chart. Scroll down to see this week's chart and to see a library of previous releases.
Download the full weekly bulletin covering December to current, or email us to receive this week's market daily bulletin for the next 30 days FREE
markethotspots@gmx.com
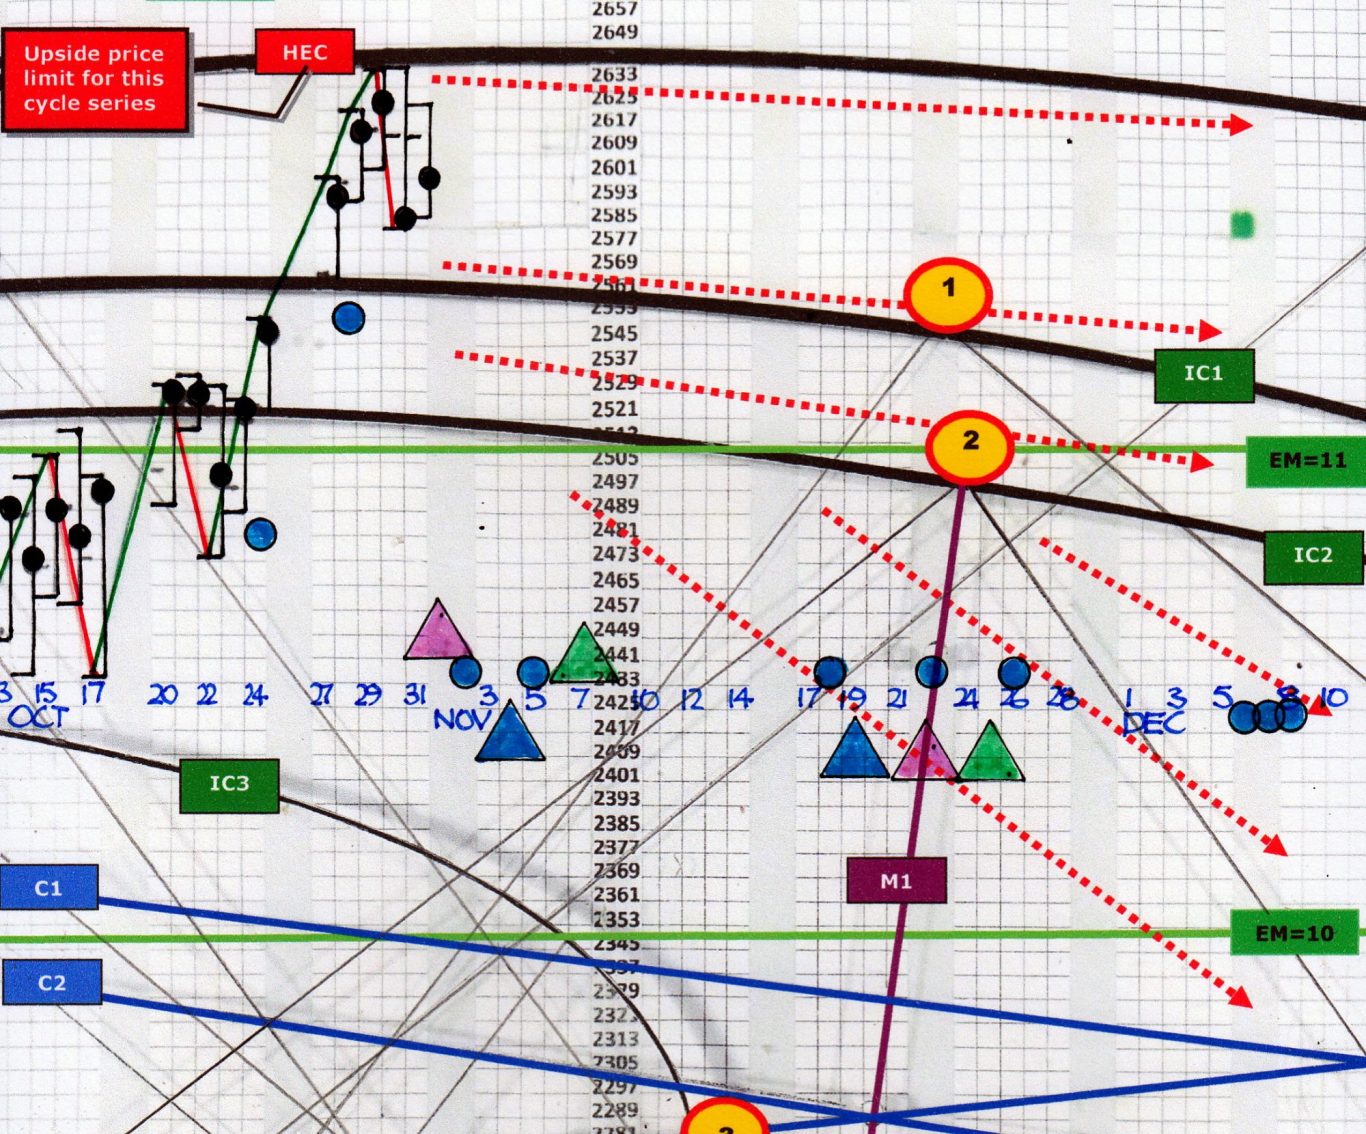
Nasdaq made a top precisely on HEC on the 29th October 2025, (see chart below) and we consider this to be the top of the bull cycle running from Q4 2022. This top is marked as EMt 0 at 2674 (26740). It is likely the second bear market top will be at target 1. However, it is possible……………
………….. Nasdaq can break up through IC1 & IC2 and make the second bear market top at HEC. The blue C1 & C2 lines indicate the trend angle through to the first half of 2026 and price will need to fall back to these lines in January/February.
Our weekly Hi-Tech Chart 5th January '26
GB Pound
Each Monday we upload a new sample of a Hi-Tech Chart. Scroll down to see this week's chart and to see a library of previous releases.
Download the full weekly bulletin covering December to current, or email us to receive this week's market daily bulletin for the next 30 days FREE
markethotspots@gmx.com
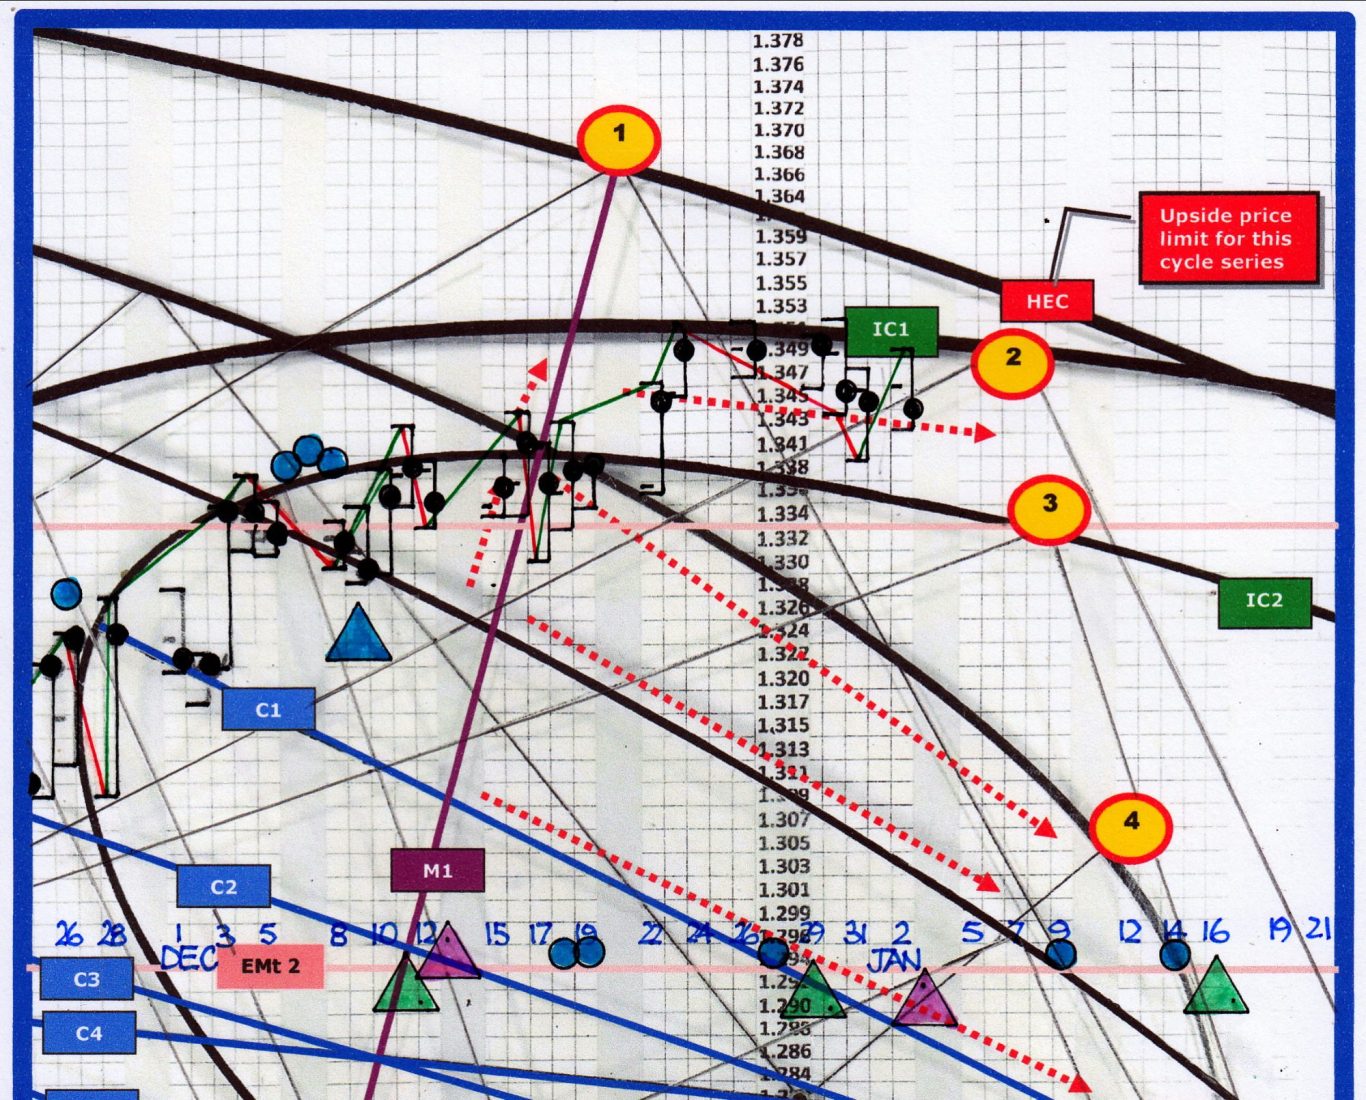
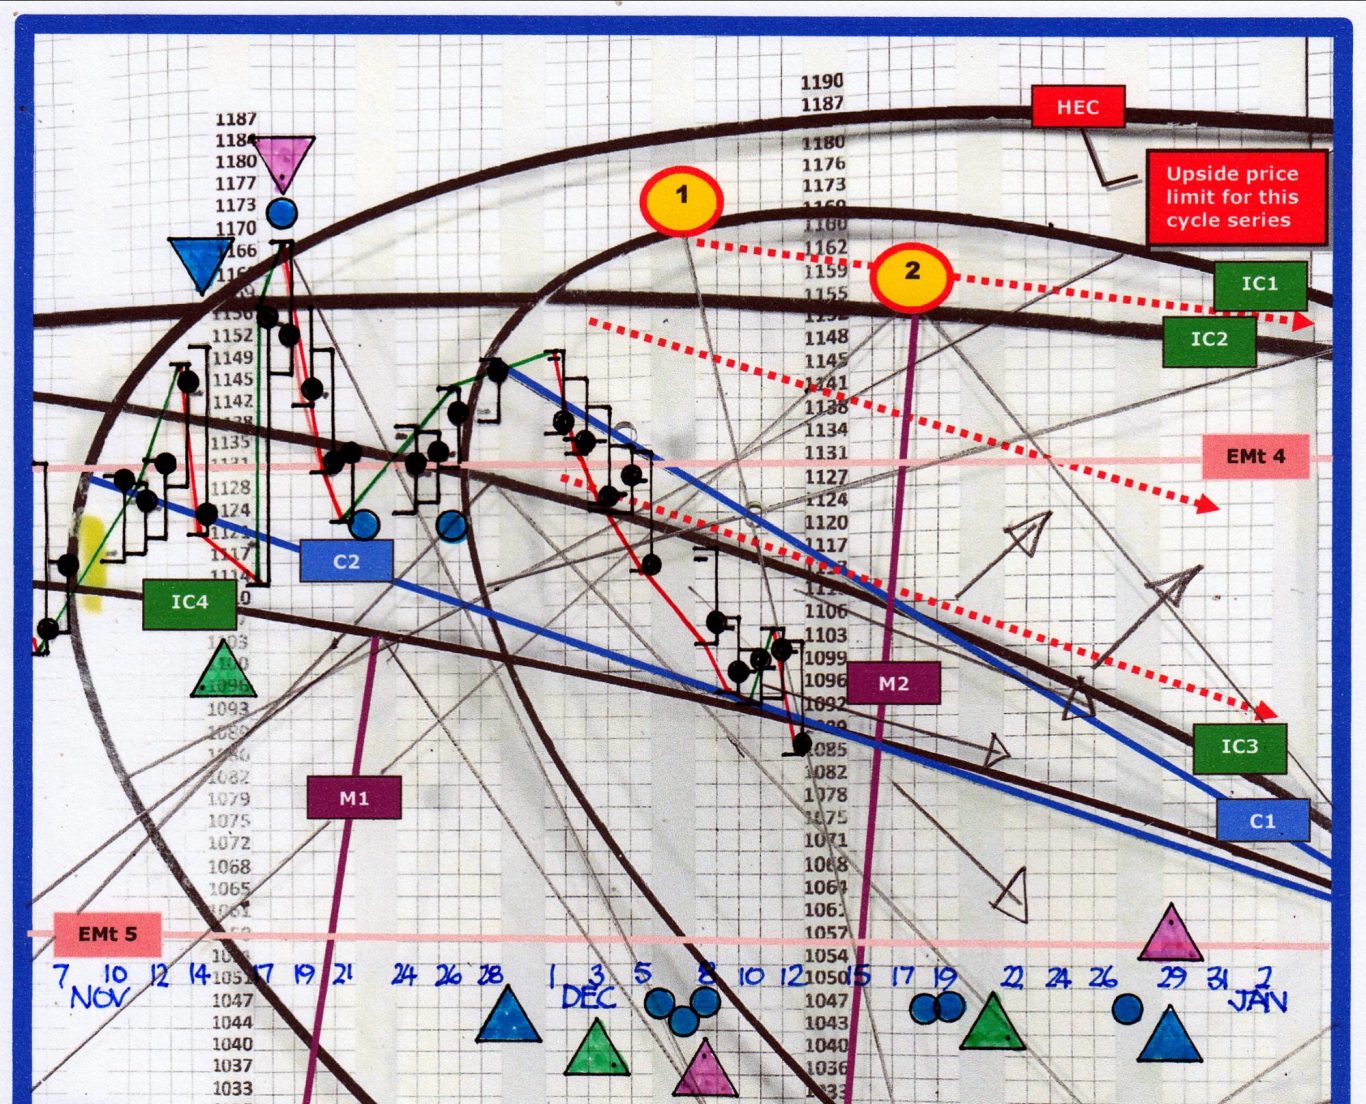
This GB Pound analysis was released on 10th December. Price has been pushing up against overhead resistance through December and is now reaching the upper price limits at IC1 and HEC .........
.........Target 2 is likely the time frame when GBP will fall back to cycle centres of the blue C lines in the coming months. We judge GBP to be in the early stages of a bear market, so this likely top will represent a major bear market top.
The full bulletin is available at www.hi-techcharts.com
Our weekly Hi-Tech Chart 29th December '25
Gold
Each Monday we upload a new sample of a Hi-Tech Chart. Scroll down to see this week's chart and to see a library of previous releases.
Download the full weekly bulletin covering October to current, or email us to receive this week's market daily bulletin for the next 14 days FREE
markethotspots@gmx.com
Gold is in steep up cycles (Blue C line angle). Note how these trend lines controlled Gold’s rise from late November. A break up through the ending IC4 cycle before its end indicates strength, but .........
.........markets like to trade into the end, or at target 2 around $4330. That is the reason for the 4.59% fall on 29th December. The very end of the IC4 cycle is down at $4250 and Gold may trade there on 30th or 31st December.
The full bulletin is available at www.hi-techcharts.com
Our weekly Hi-Tech Chart 22nd December '25
SP500
Each Monday we upload a new sample of a Hi-Tech Chart. Scroll down to see this week's chart and to see a library of previous releases.
Download the full weekly bulletin covering October to current, or email us to receive this week's market daily bulletin for the next 14 days FREE
markethotspots@gmx.com
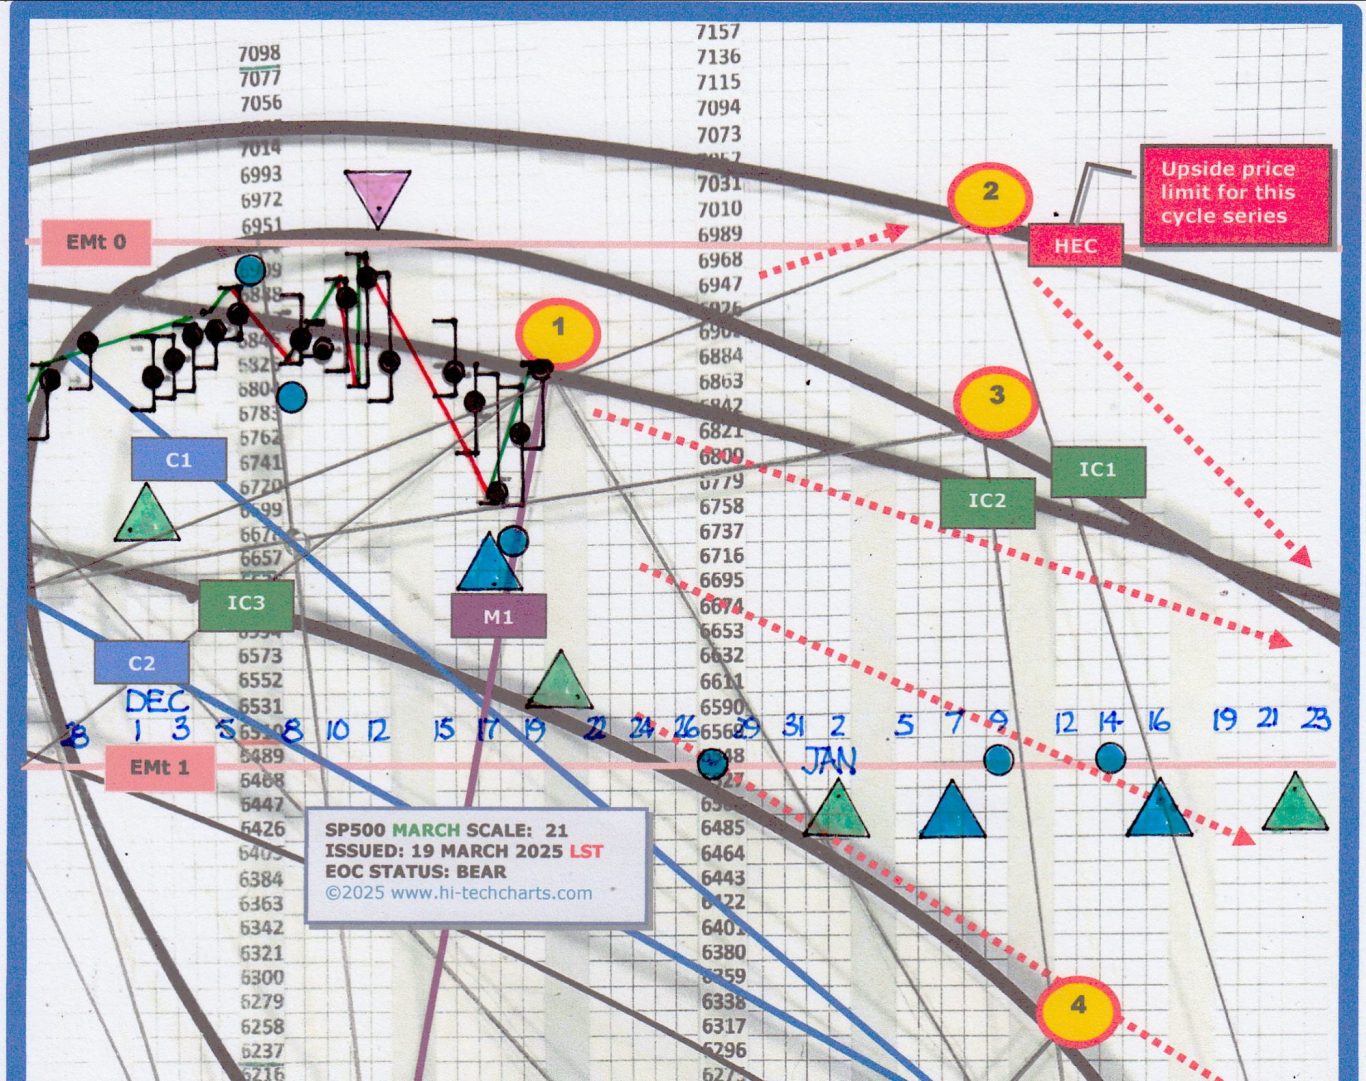
All indications are that the top of 11th December 2025 (hitting IC1) represents the end of the bull market that has been running since the October 2022 bottom. A bear market is apparent based on the angle of the blue C lines, which represent the angle of trend that will control price action for at least 6 months. Week commencing 22nd December is critical since price is up against powerful resistance at IC1 & IC2.........
.........While closes remain below IC1 SP500 will trade in the IC1/IC3 channel through January. It is possible price could break up to top out at target 2 (8th January at 7010) but time is against this. SP500 will need to be down at the C lines (C3 – C5) by February.
The full bulletin is available at www.hi-techcharts.com
Our weekly Hi-Tech Chart 15th December '25
Soybeans
Each Monday we upload a new sample of a Hi-Tech Chart. Scroll down to see this week's chart and to see a library of previous releases.
Download the full weekly bulletin or email us to receive this week's market daily bulletin for the next 14 days FREE
markethotspots@gmx.com
Soybeans – a major top and a fall into a significant bear trend. In our www.hi-techcharts.com ‘Chart of the week’ below, Soybeans made a major top at our extreme overhead resistance line on 18th November, signalling a short trade........
.........Two new cycles highlight a fairly steep bear trend as indicated by lines C1 & C2 and this trend will impact price direction for at least 3 months. IC3 & IC4 are the last support lines until lower support around $1000 comes into play.
Our weekly Hi-Tech Chart 8th December '25
Silver
Each Monday we upload a new sample of a Hi-Tech Chart. Scroll down to see this week's chart and to see a library of previous releases.
Download the full weekly bulletin or email us to receive this week's market daily bulletin for the next 14 days FREE
markethotspots@gmx.com
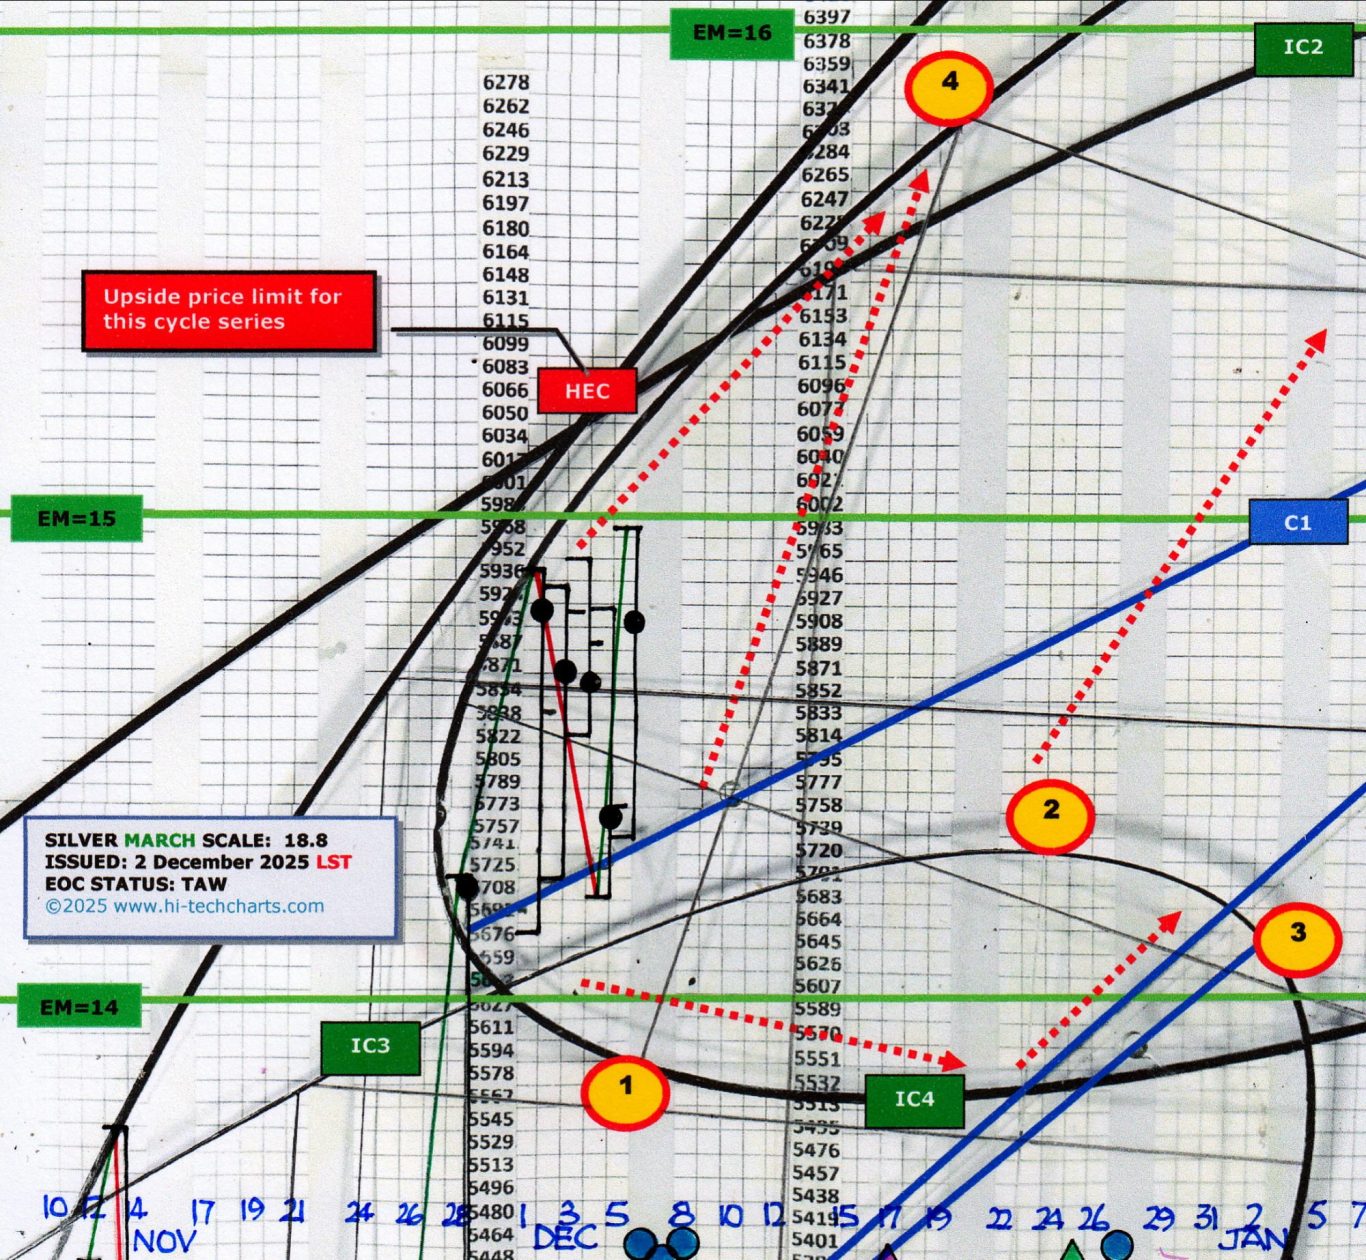
Silver - Note the steep angle of trend as indicated by the C lines, projecting direction for at least the next 6 months. Given Silver’s strength, it is likely it will travel up the indicated channel to hit target 4 – a point often producing a significant pull-back; to the C lines, or lower. .......
........This scenario is valid as long as closes hold above IC3. Price action below IC3 would indicate Silver runs in the IC3/IC4 channel through to the 1st week of January.
Our weekly Hi-Tech Chart 1st December '25
Crude Oil
Each Monday we upload a new sample of a Hi-Tech Chart. Scroll down to see this week's chart and to see a library of previous releases.
Download the full weekly bulletin or email us to receive this week's market daily bulletin for the next 14 days FREE
markethotspots@gmx.com
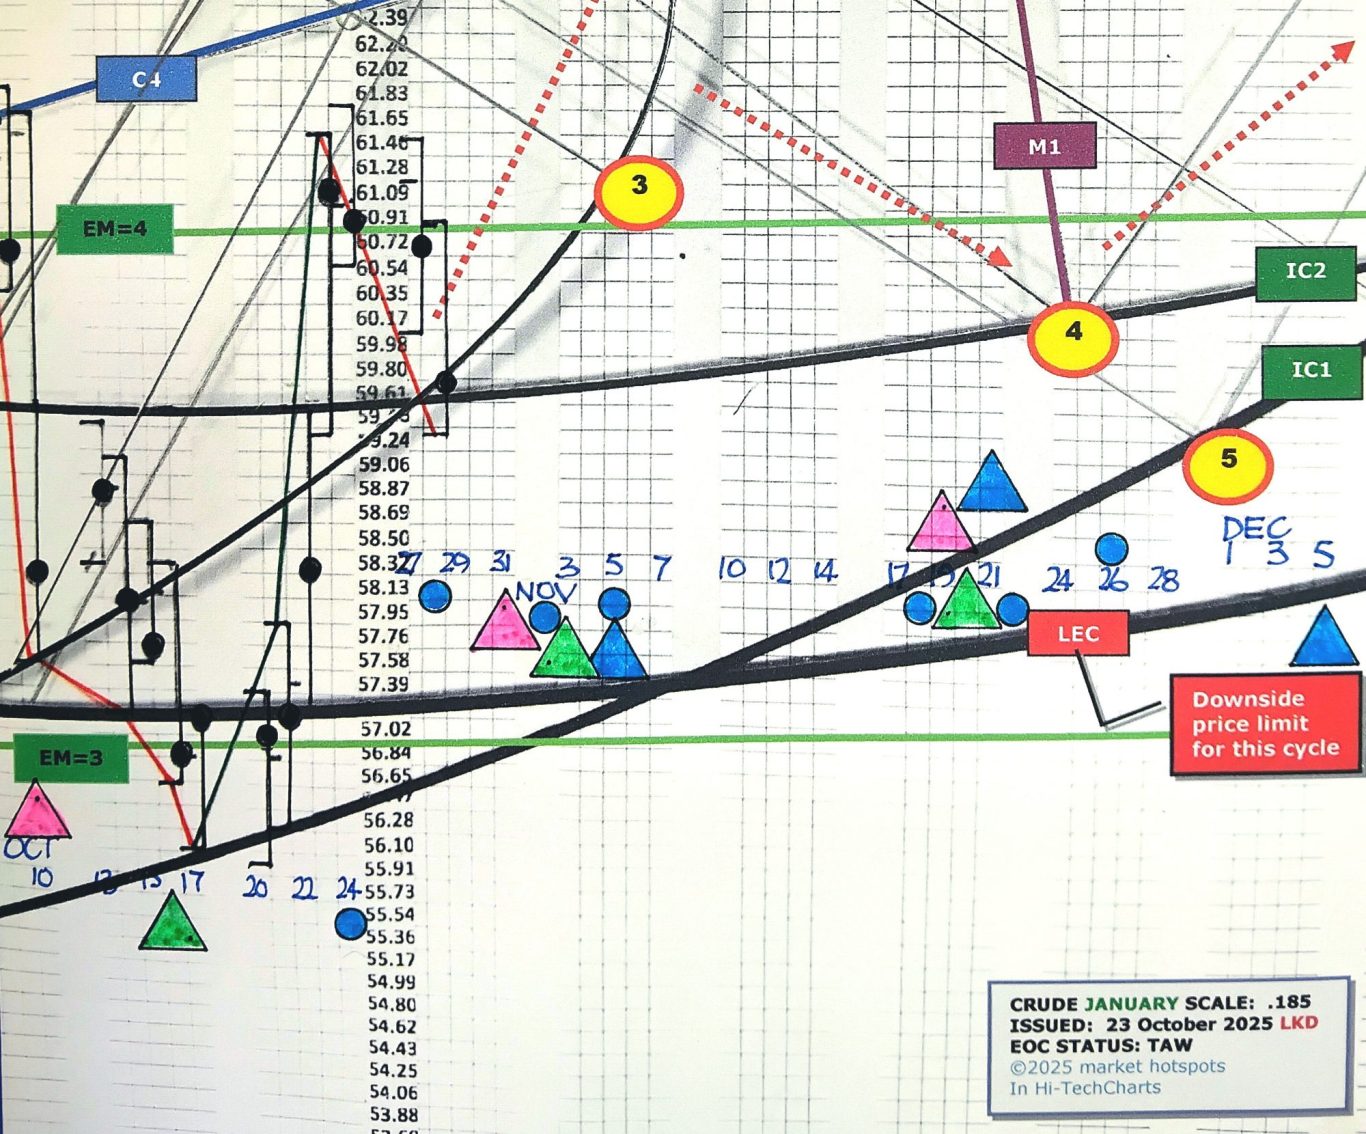
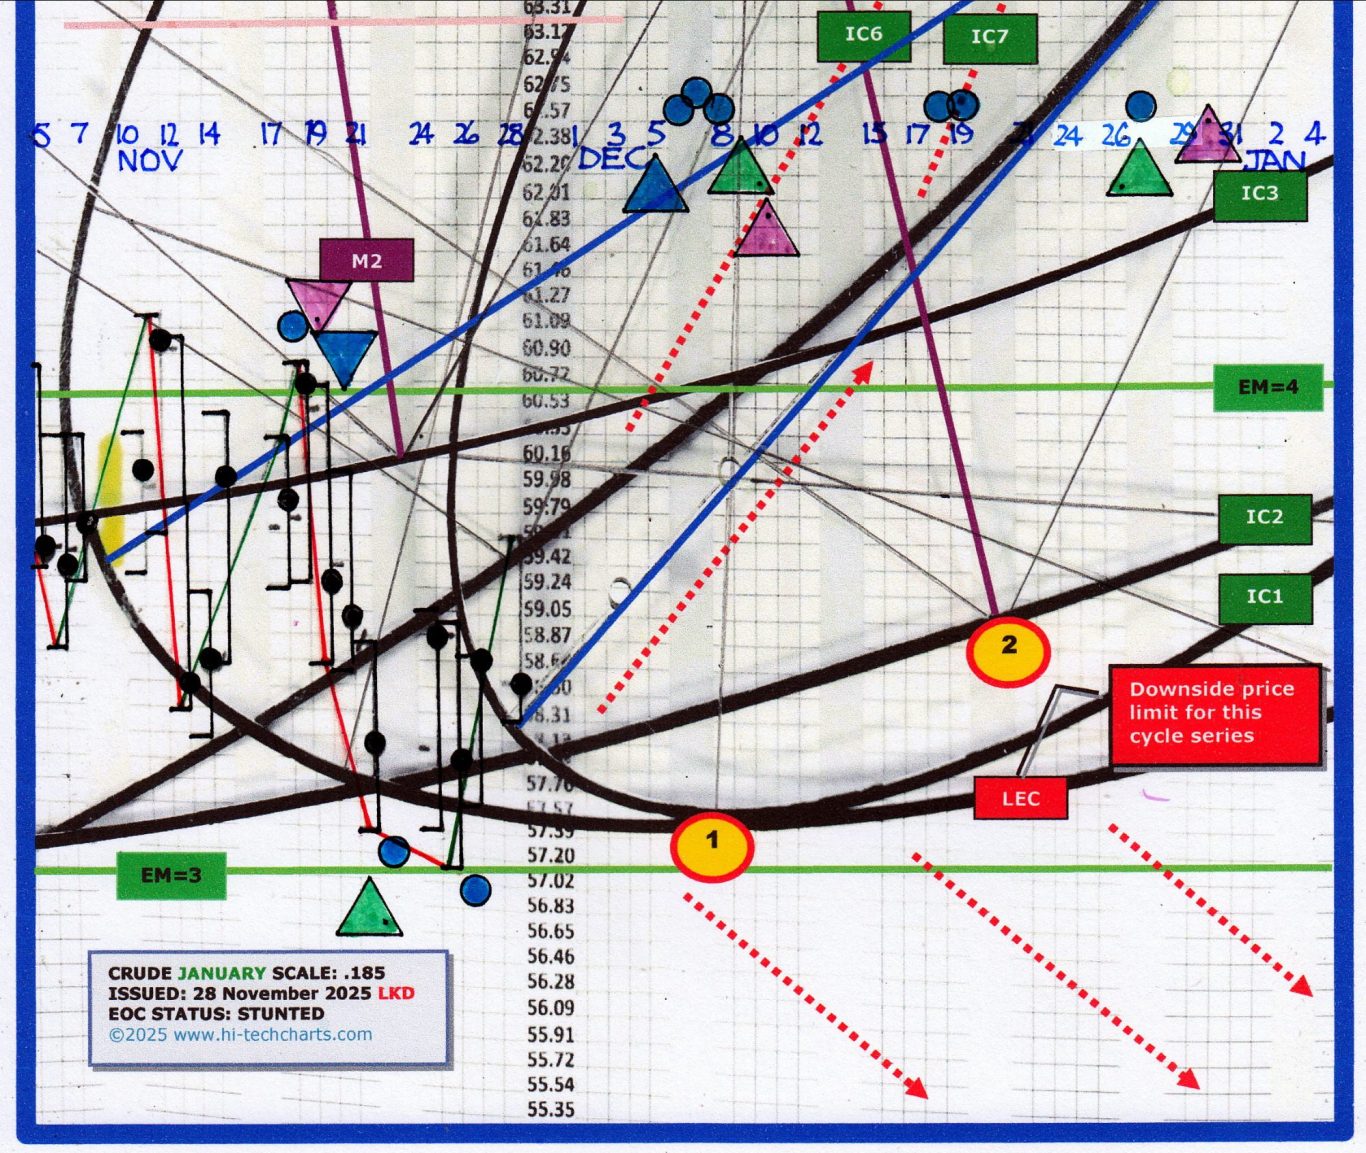
WTI CRUDE – is at the divide of either a very steep run up to around 68.00 by late January; or a fall into a new bear cycle series. If a steep rally occurs, price action will occupy the IC5/IC4 channel and trade above the C1/C2/C3 lines.
If closes fall below LEC, that will confirm steady falling prices. The fall is more likely since the upside angle looks too steep, unless a political crisis occurs in a matter of days, causing panic buying.
Our weekly Hi-Tech Chart 21st November '25
Nasdaq
Each Monday we upload a new sample of a Hi-Tech Chart. Scroll down to see this week's chart and to see a library of previous releases.
Download the full weekly bulletin or email us to receive this week's market daily bulletin for the next 14 days FREE
markethotspots@gmx.com
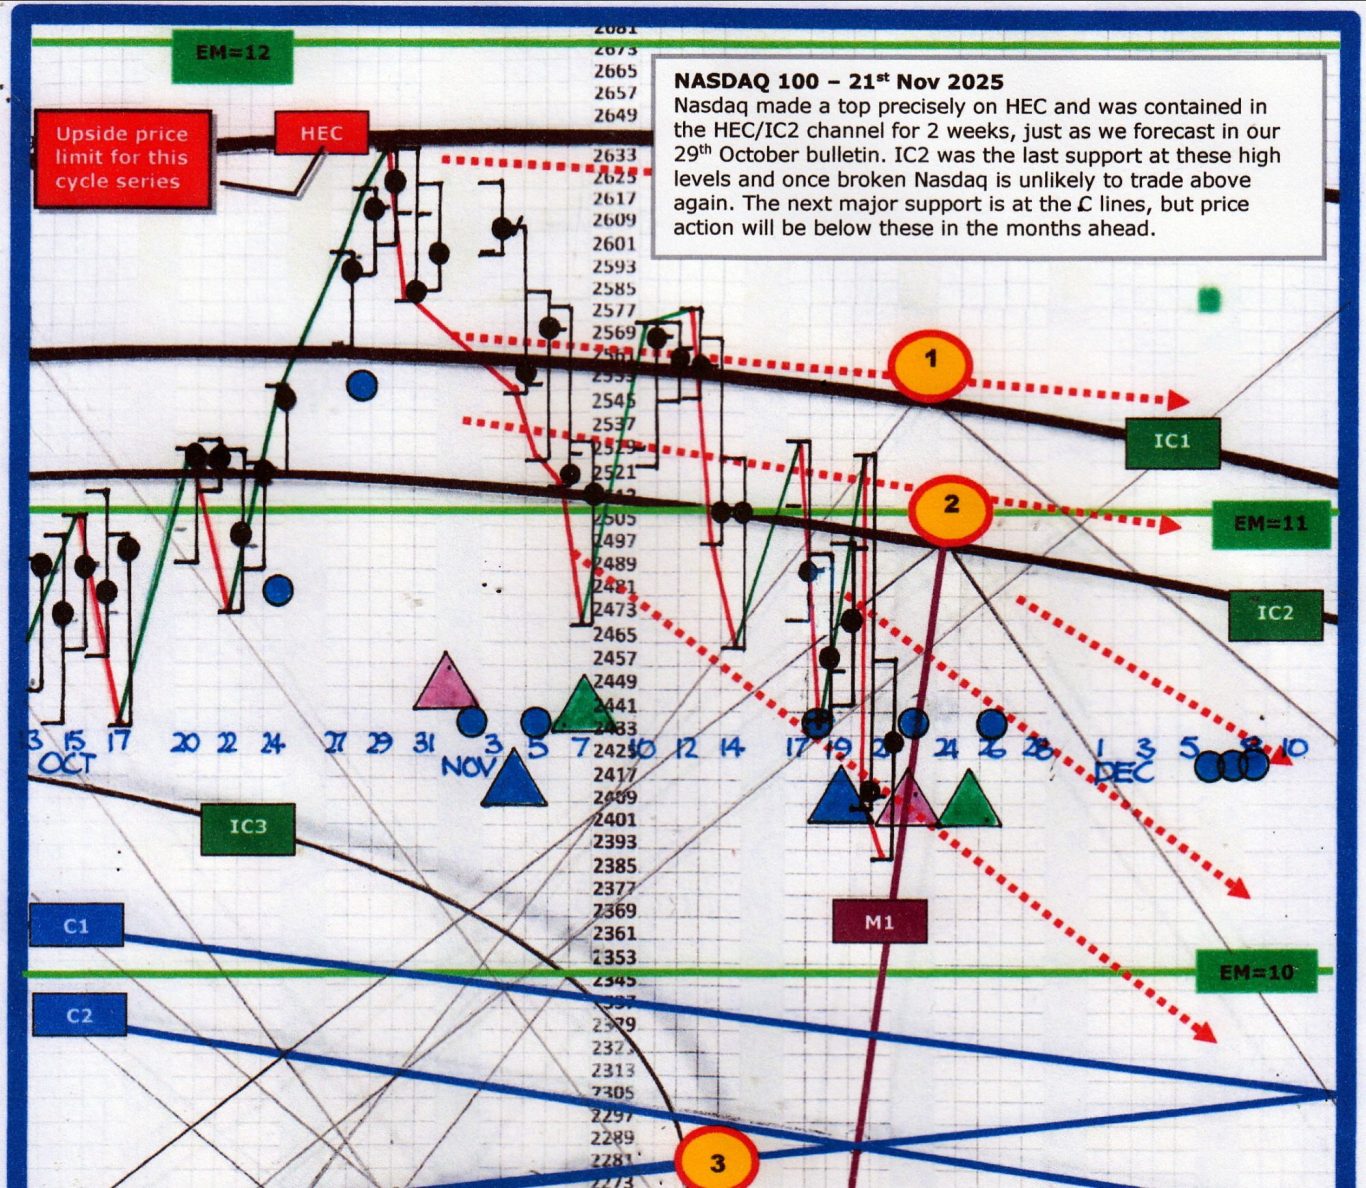
In our Nasdaq bulletin of 29th October 2025 we predicted a major top at line HEC. Nasdaq made a top precisely on HEC and was contained in the HEC/IC2 channel for 2 weeks, just as forecast. The chart below is an update on 3 weeks following the 29th October top……
…….Line IC2 is the last support at these high levels and once broken, Nasdaq confirms the start of the first leg down in what we believe is a new bear market. The next major support is at the C lines, but price action will fall below the C lines in the months ahead.
Our weekly Hi-Tech Chart 17th November '25
Bitcoin
Each Monday we upload a new sample of a Hi-Tech Chart. Scroll down to see this week's chart and to see a library of previous releases.
Download the full weekly bulletin or email us to receive this week's market daily for the next 14 days FREE
markethotspots@gmx.com
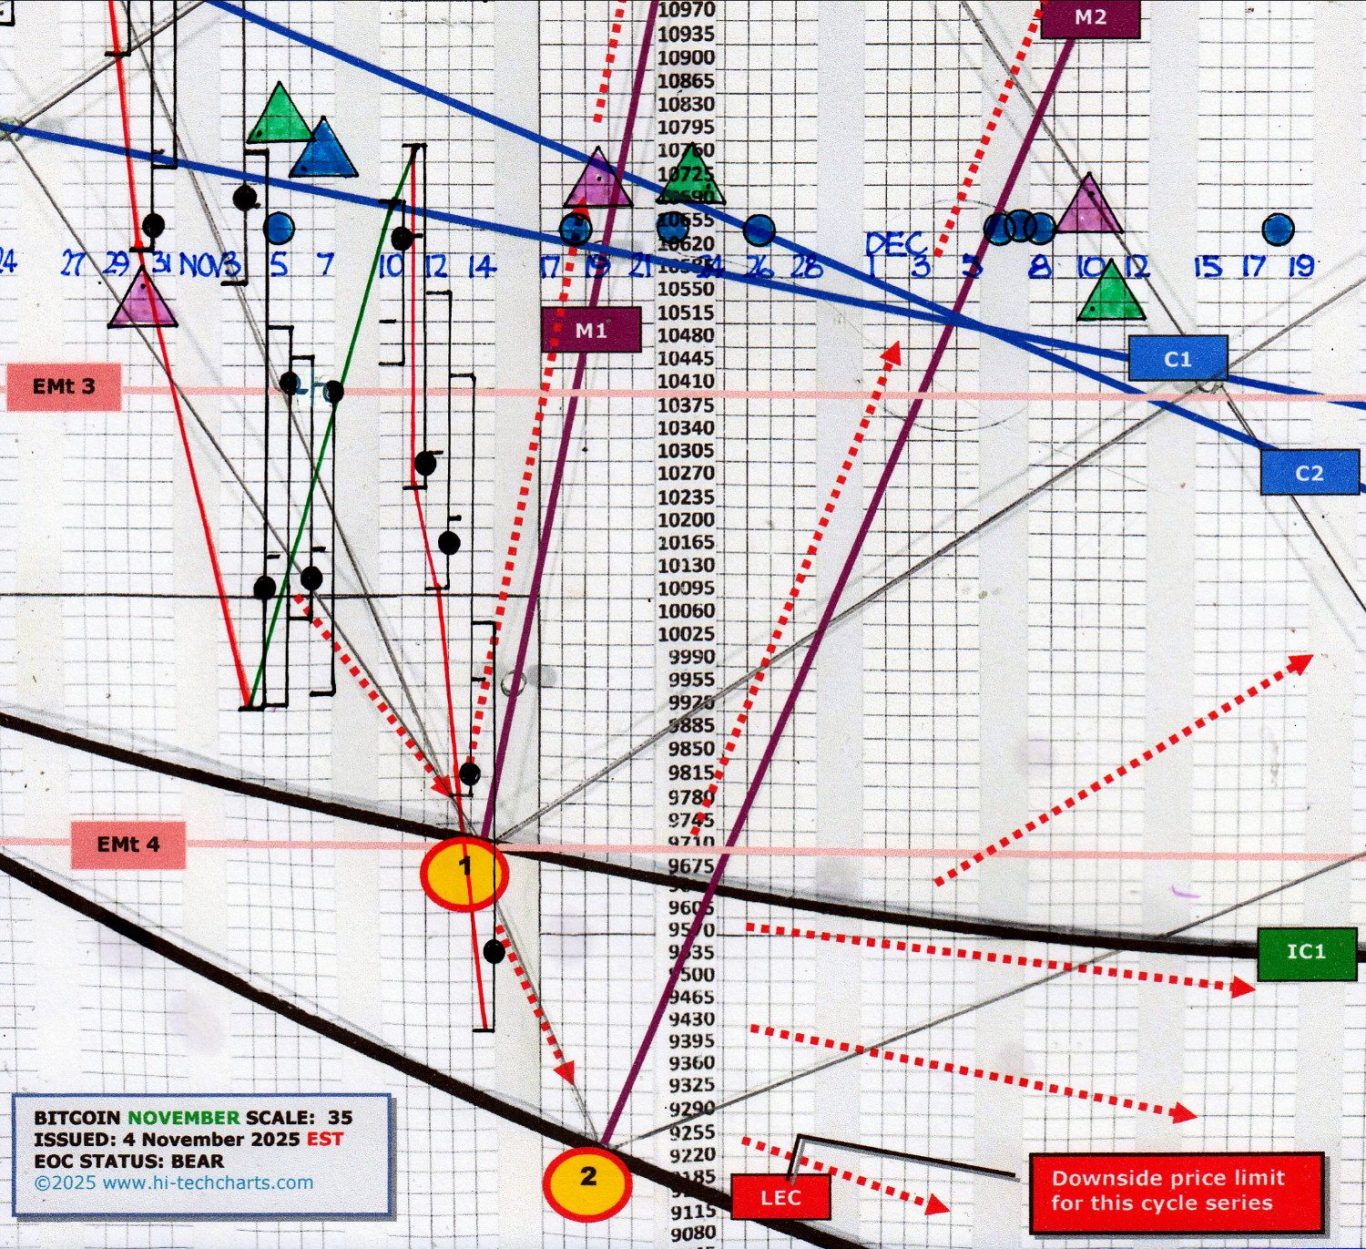
In mid-October Bitcoin broke out of bull cycles and is now in bear cycles, the medium-term trend angle is indicated by C1 & C2. We expect a major bottom and the start of a significant bear market rally and that is likely to come from major support at IC1, or lower, at LEC. .........
........Of importance is the potential of M1 & M2 to force rallies extending to each overhead resistance line, in this case, C1 & C2. M lines can push price up their full extent. Major bottoms very often occur at target 2.
Our weekly Hi-Tech Chart 10th November '25
Gold
Each Monday we upload a new sample of a Hi-Tech Chart. Scroll down to see this week's chart and to see a library of previous releases.
Download the full weekly bulletin or email us to receive this week's market daily for the next 14 days FREE
markethotspots@gmx.com693619ad-07f6-48d1-8090-4c4f8e532297
Gold is in steep up cycles (C line angle). From the top on 17th October, (occurring at HEC, extreme upper price limit, and at two EM cycles (coloured triangles)) price was destined to hit targets 2 & 3.
Gold is now at a critical position, strongly supported by the cluster of C lines. M1 is a powerful resistance line and once price crosses to the right side, Gold is free to run up to M2.
Our weekly Hi-Tech Chart 4th November '25
Nasdaq 100
Each Monday we upload a new sample of a Hi-Tech Chart. Scroll down to see this week's chart and to see a library of previous releases.
Download the full weekly bulletin or email us to receive this week's market daily for the next 14 days FREE
markethotspots@gmx.com
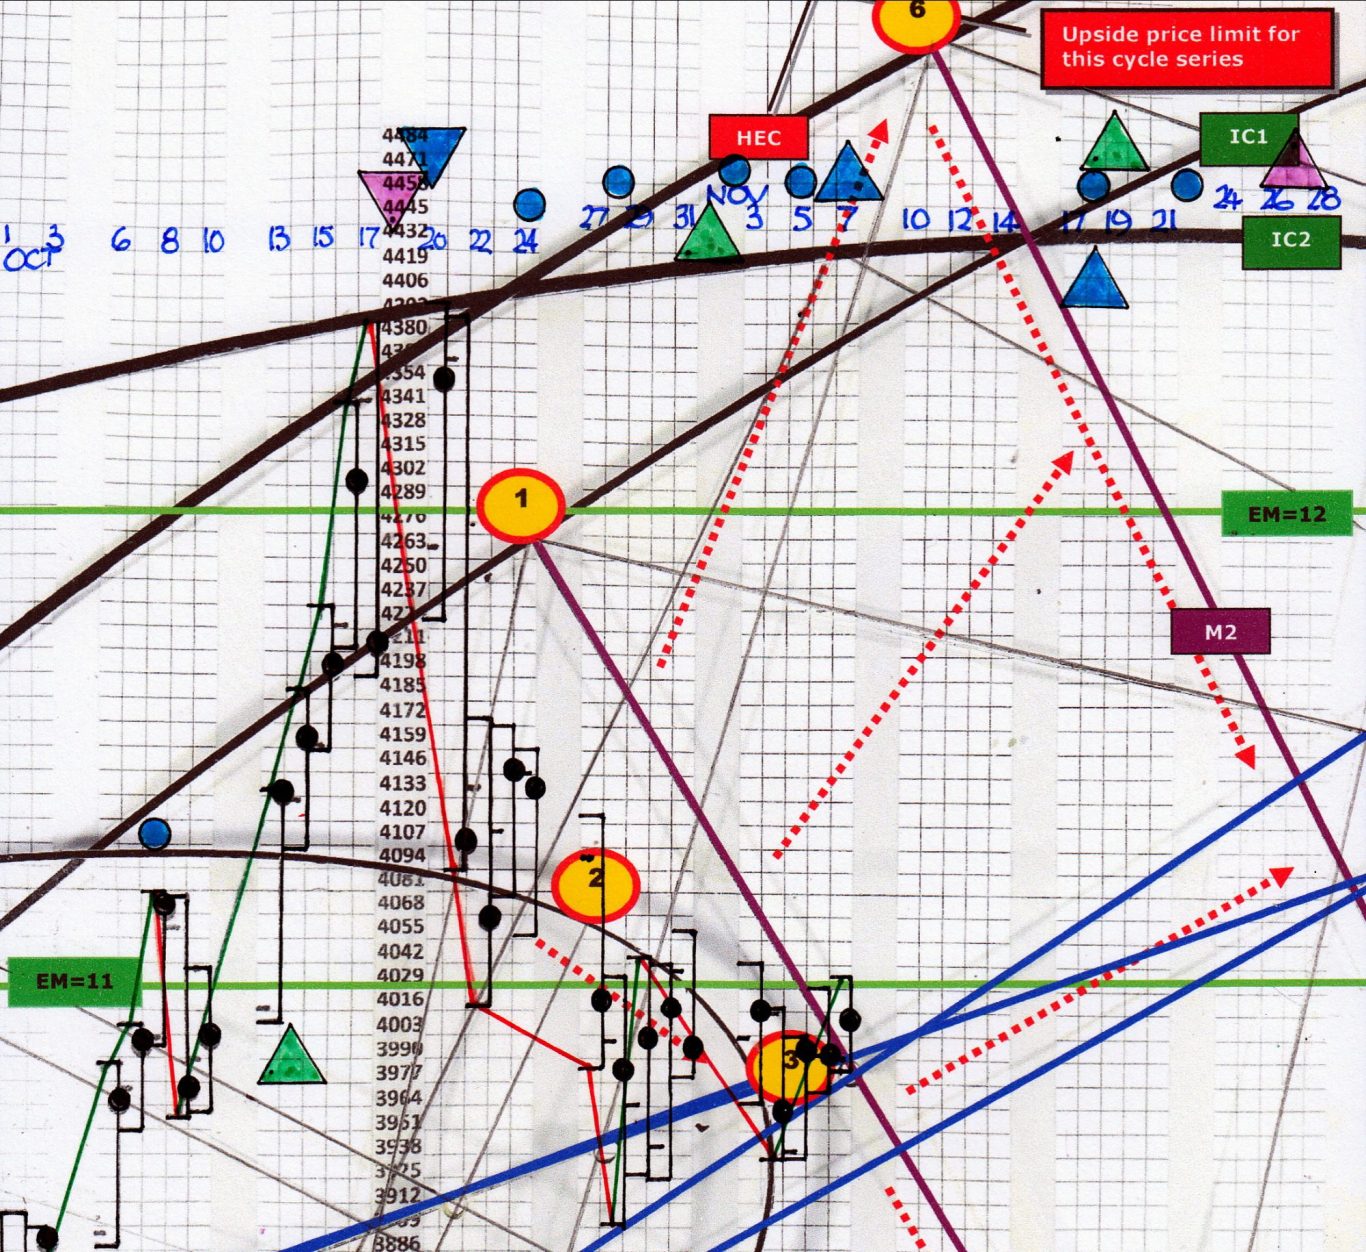
If Nasdaq remains in this cycle series, we expect a bull market top to form at HEC, the upper cycle limit. EM=12 is 12 cycles up from the 12th October 2022 bear market bottom – 12 cycles is around the historical high for Nasdaq. Intra-day price may extend up to EM=12……..
……… but on for 2-3 days maximum. Nasdaq is likely occupy the HEC/IC2 channel for a period but not beyond December. The initial fall in a new bear market will take price to the C lines and eventually below 21100.
Our weekly Hi-Tech Chart 27 October '25
Crude Oil
Each Monday we upload a new sample of a Hi-Tech Chart. Scroll down to see this week's chart and to see a library of previous releases.
On 10th October we the likelihood Crude would contact the down side limits - LEC/IC1 - and this would be a major bottom. There is the potential for Crude to hit target 2.
Crude will need to spend time above the C lines (C1,C2,C3). That may take until December.