About Us

Who We Are
Highly experienced and motivated professionals
Our family-run business enterprise has a long tradition in the industry - market research starting in 1991 by Geoff & Rodd Day and focusing on how natural cycles impact markets. The result is a technology breakthrough. Our expertise gained over a 35 year period ranges from computerised systematic trading systems, successful fund management running a strategy in a large hedge fund since 2016, and superior Hi-Tech Charts analysis. We pride ourselves on outstanding customer service. We have one client who is still with us after 20 years.
Hi-Tech Charts Overview
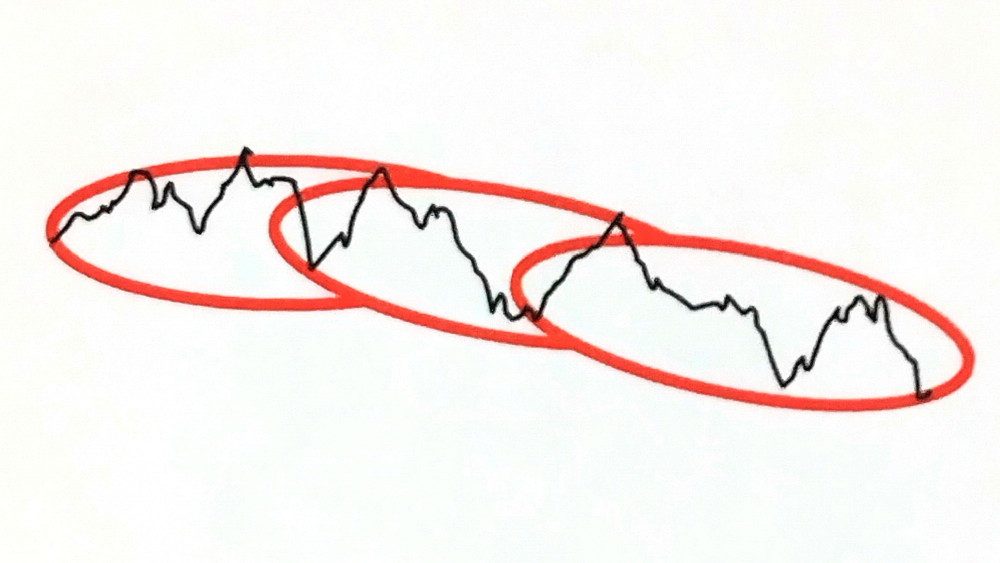
Hi-Tech Charts are a mapping of the elliptical cycles controlling market price action. In essence, markets are not random but rather, move inside elliptical cycles. The phenomenon is that the movements of all markets are contained within their particular elliptical cycle series, as demonstrated in this diagram. And since the location of cycles are known in advance, then the future direction of a market can be forecast, together with many major tops and bottoms. Our innovative charting tools offer unique insights into market trends, assisting both novice and experienced traders in navigating the financial landscape effectively.
Long term cycle analysis
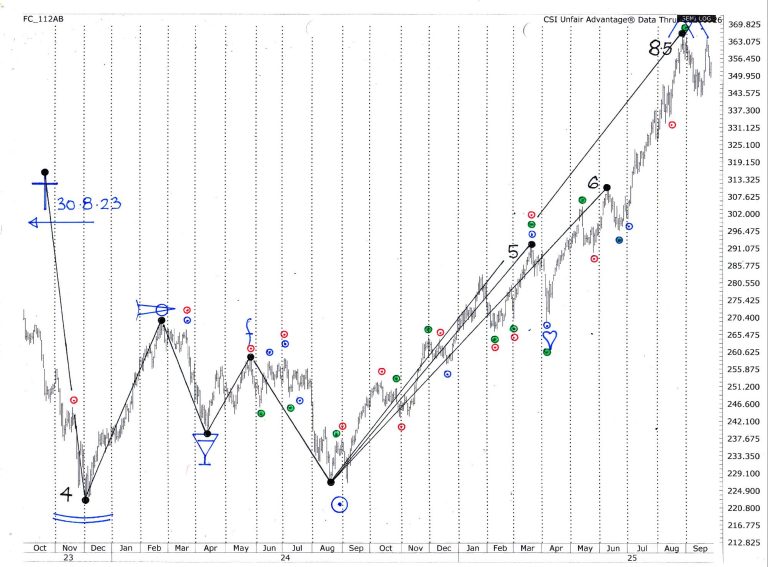
Hi-Tech Charts are multi-faceted, containing tools to suit almost every trading style, from day trading, to medium term trend following, swing trading, options, and long term position trading. Included in our daily bulletin is a chart presenting each market's bull-bear-bull cycle. At left is Silver showing the segment from its bear market bottom (December 2021) to the September 2025 top. These charts help longer term traders, showing what part of a cycle a market is in. Not only that, they demonstrate the power of our indicators. The coloured triangle in the Hi-Tech Charts appear as small coloured circles in the Silver chart at left, and it can be seen almost all fall on major tops & bottoms, or accelerate to trend.
Cycles in 3 dimensions
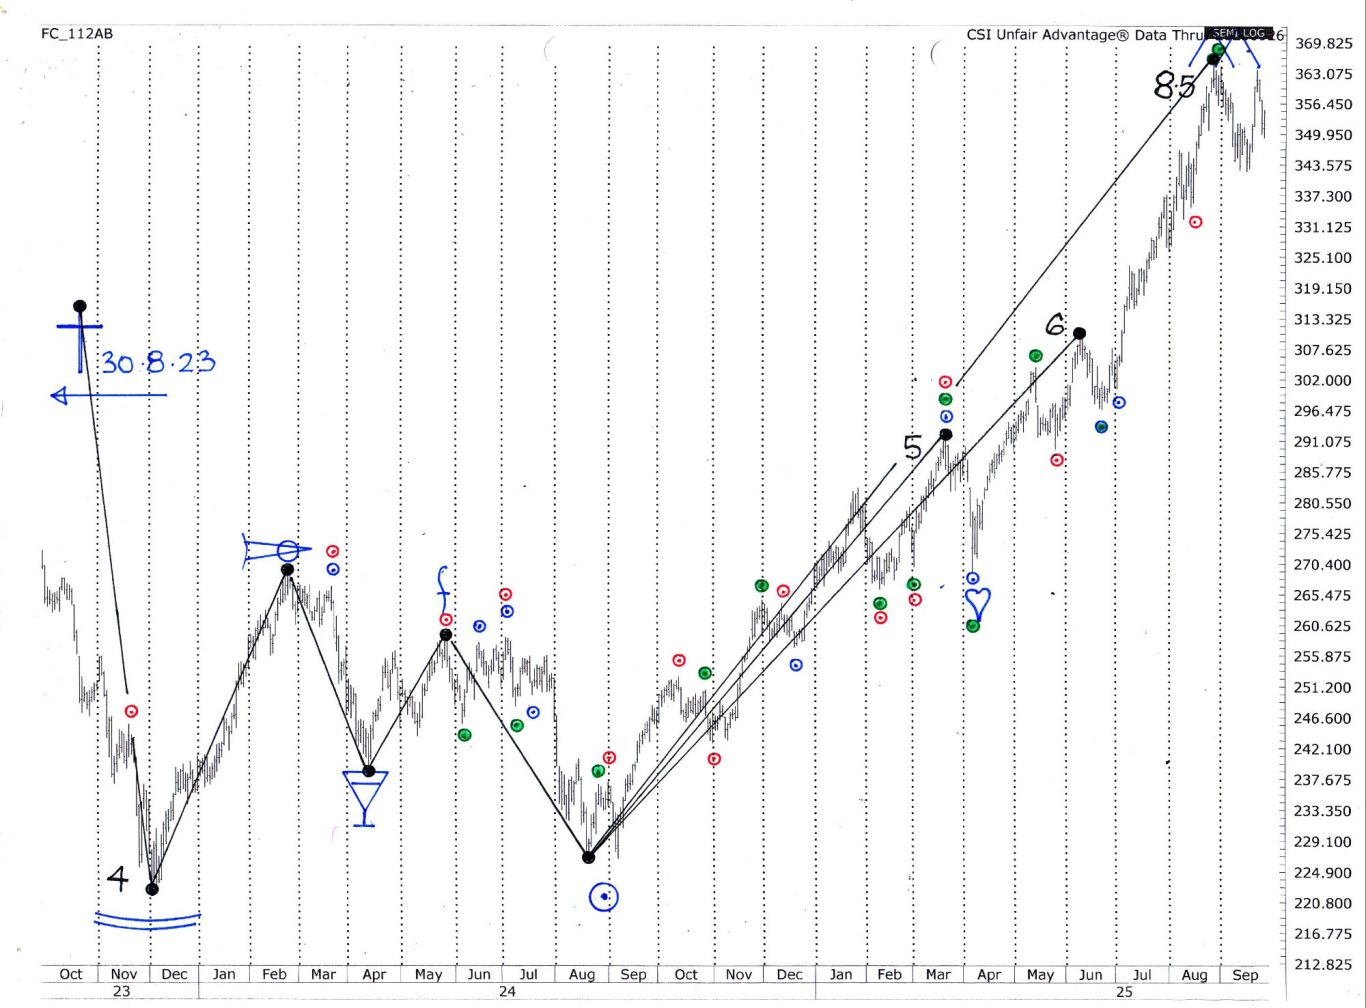
The mathematics of elliptical cycles control 3 dimensions - time, price and trend angle. This is demonstrated in the Silver chart at right. The black lines joining tops to bottoms and vice versa, represent multiples of our cycles on the vertical axis, or price. It can be seen how many major moves travel specific cycle multiples, e.g. from the August 2024 bottom Silver made tops at cycle multiples of 5, 6, & 8.5.