Tagline
Arranged below are historical 'before & after' selections of Hi-Tech Charts
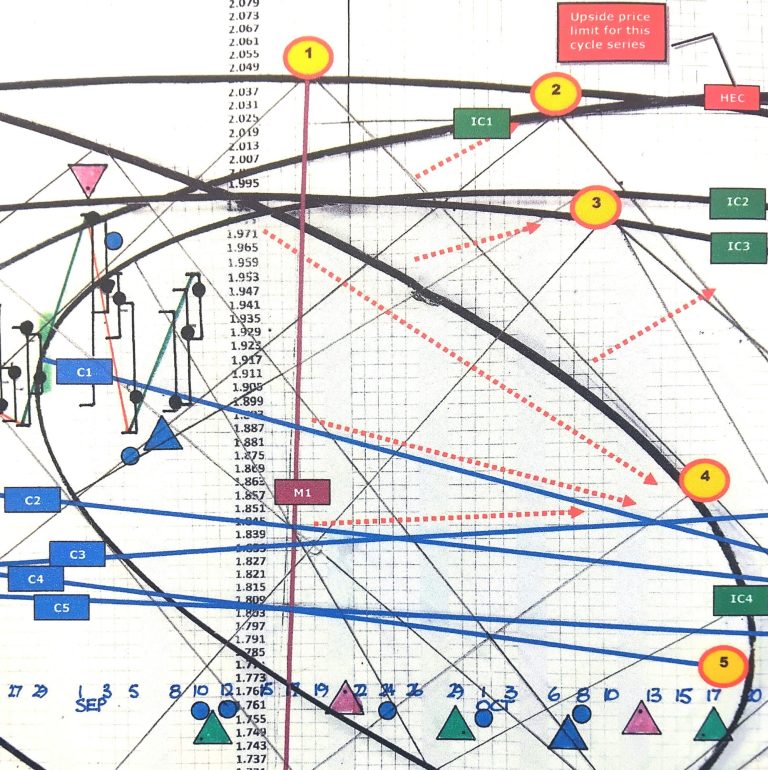
TOP CHART...Gasoline makes a top at triple overhead resistance lines IC1, IC2, IC3. IC3 has the potential to force price action below it. BOTTOM CHART....price trades below IC3 (now IC4) and hits target 2. Gasoline is set to hit target 5. From the top on 2nd September this analysis set up a short trade from around 1.971 with clear signal to exit at target 2, around 1.7300.
These examples demonstrate market hots spots in Hi-Tech Charts
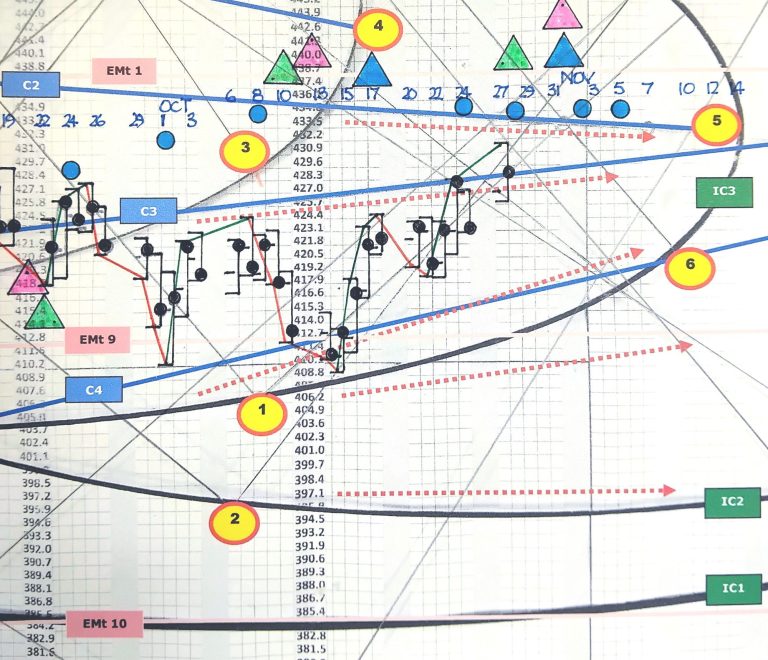
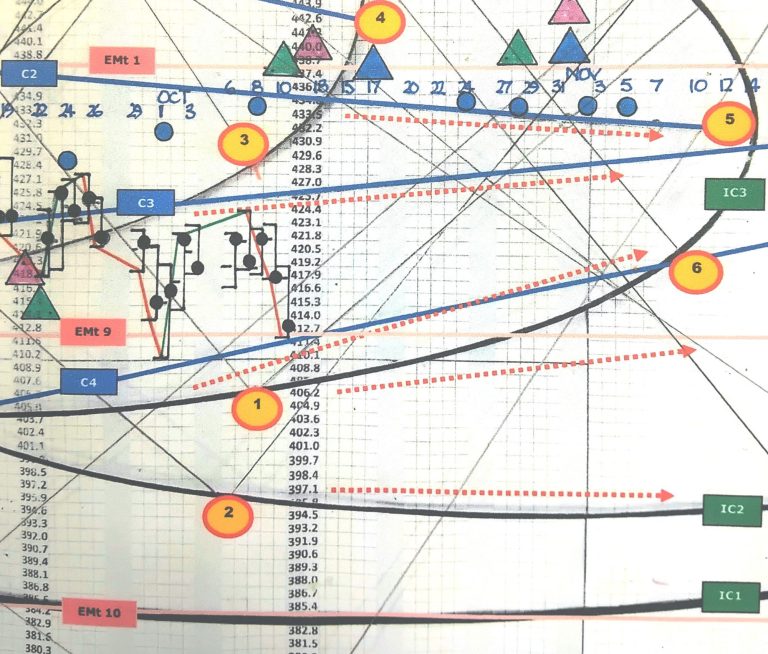
TOP CHART...Corn will rally to target 5 as long as closes hold above IC3. A long entery around 410.00 is a markethotspot. BOTTOM CHART....price contacts IC3 and rallied to likely settle at target 5.
There is a time to trade and a time not to trade
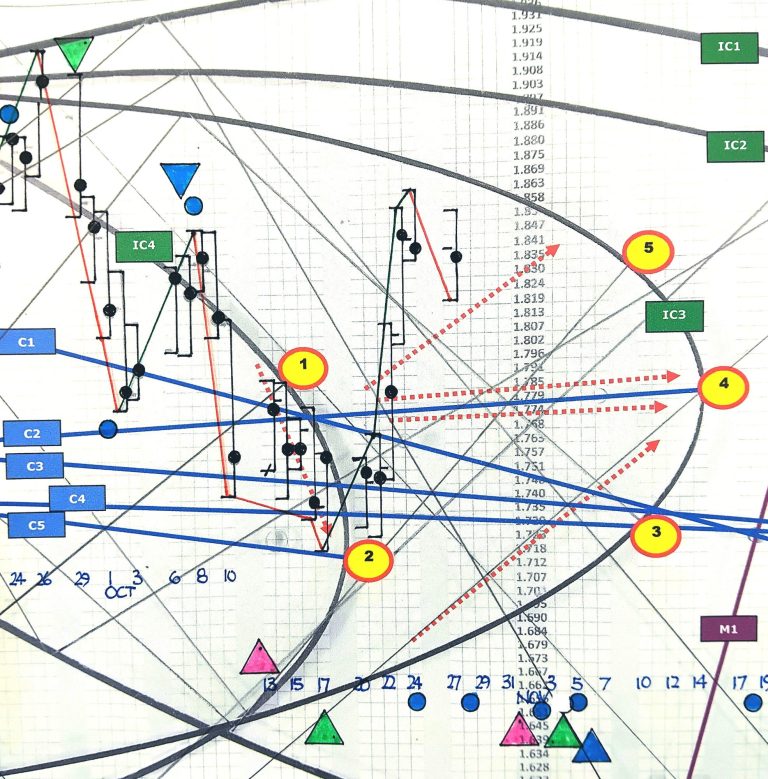
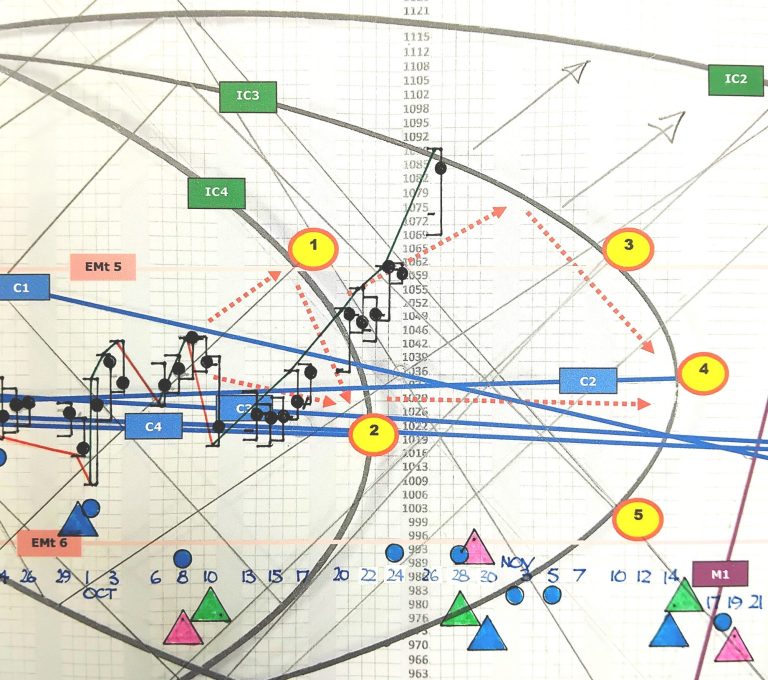
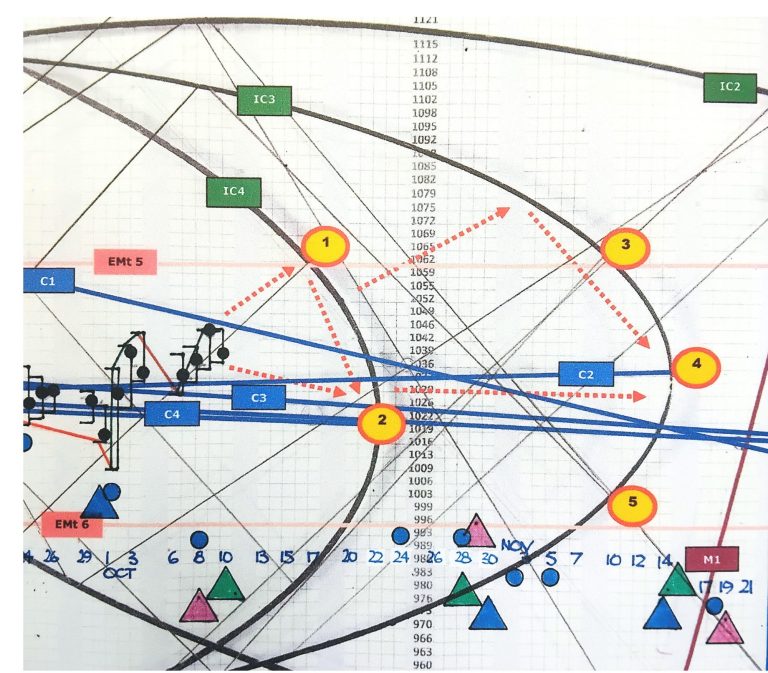
TOP CHART...There is a time NOT to trade and in this example Hi-Tech Charts keeps traders neutral when market conditions indicate unprofitable trading potential. The blue C lines create the tight range, and the narrowing end of the IC4 cycle combined, will likely trap price. BOTTOM CHART....our daily updates would have alerted traders to the potential of a long trade on a break up through IC4, a rally which should reach IC3. Either target 4 is in focus, or a break up through IC3 to hit IC2.
Boundary lines
in Hi-Tech Charts
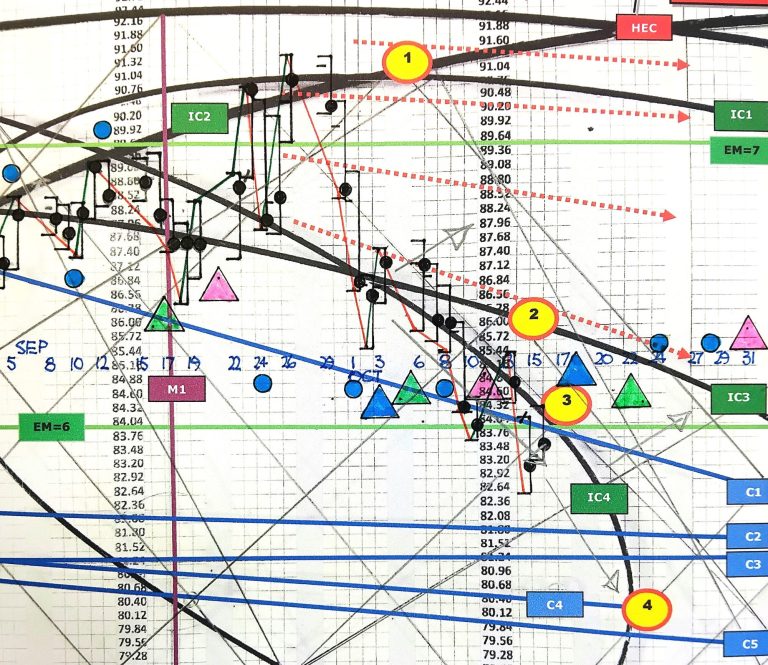
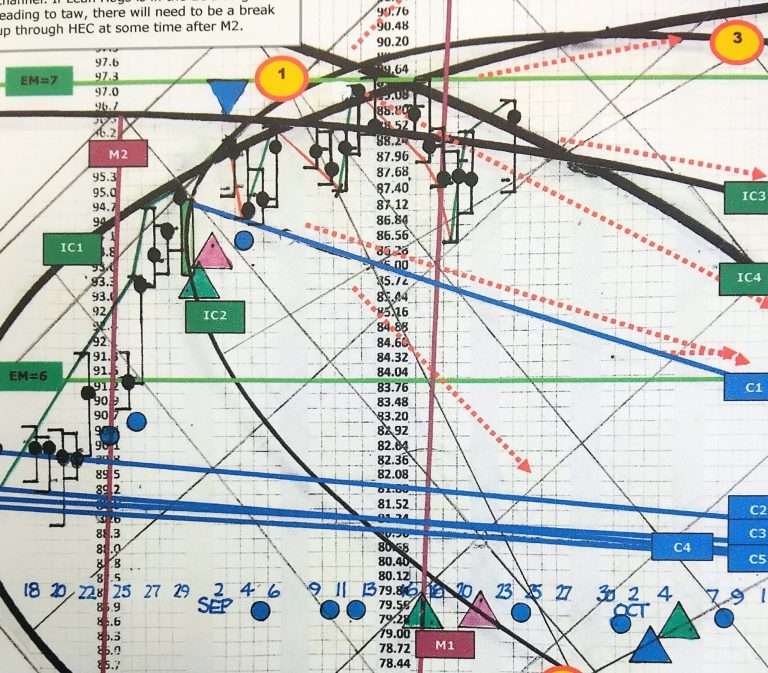
TOP CHART...Our curved lines create helpful boundary lines between being short or long. Lean Hogs is up against 4 strong upper resistance lines. Whilst price is below these, a long trade is high risk, whilst short trades offer low risk. BOTTOM CHART....price fell away from that overhead resistance and entered the IC3 cycle, IC3 can be used as an upper limit to hold the short position as long as closes are below it.
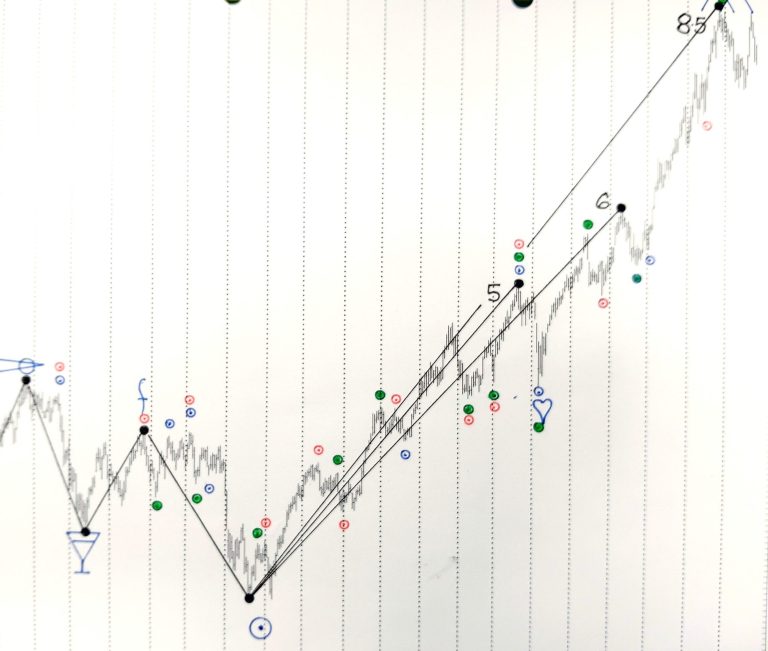
Hi-Tech Charts coordinated with long term charts to enhance trade signal accuracy
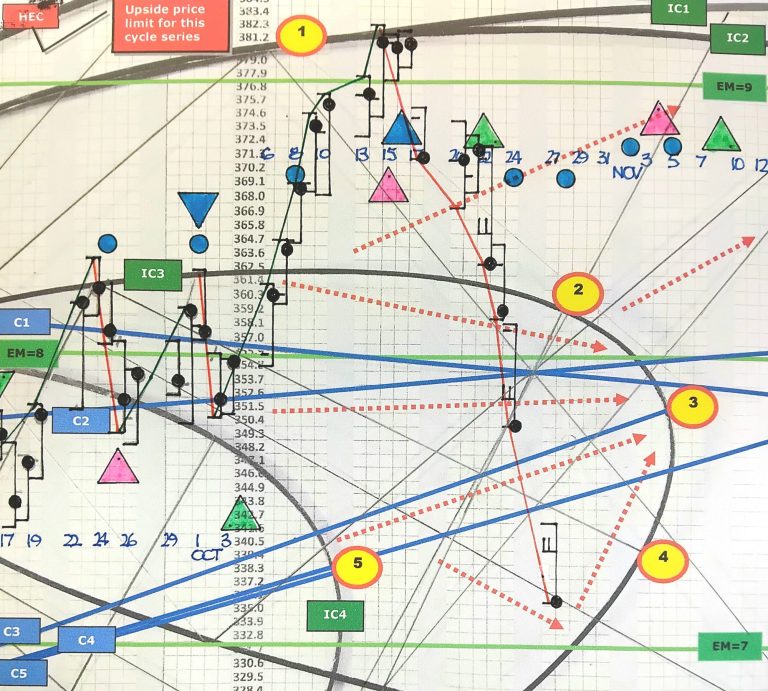
ABOVE...Feeder Cattle signals a potential top at IC1/IC2. This is reinforced by considering what segment of the bull-bear-bull cycle this market is in.
BELOW is our EOC chart ....indicates price is at a high, either the second to last major top or the actual bull market top. Hence, Feeder Cattle at around 381.00 was a strong sell signal. That top was followed by a fall that often occurs immediately following a bull market top. The steep fall includes 3 locked limit days. This fall may end at around 333.00.